SYSTEM DESIGN EXAMPLES

System Design is the skill set needed to create an operation blueprint. There are five major tools:
- Voice of the Customer – Understanding your markets and customers and crafting products and services to meet their needs will accelerate business growth.
- Flow Simplification – Creating lean, efficient, continuous flows are the building blocks of high speed, flexible, resilient operations.
- Value Steam Analysis – Deep dive analysis of your products, material flows and information flows will reveal opportunities to make your operation best in class.
- Supply Chain – Development of a unified delivery system will make your operation unassailable.
- Shikumi Diagram – We bring design expertise only found at the highest levels of lean excellence.
Voice of the Customer Example

Background and Projected Improvements
A VOC was conducted for a leading manufacturer of water quality products. The client was challenged to increase market share and sales growth had slowed significantly over the past decade. The first step in our analysis was to understand what was important to the customer.
Estimated Improvement Metrics

Customer Lead Time 50% Shorter
In Stock Percent 100% Higher

Shipping Costs 15% Lower

Split Shipments 50% Lower
The Process
We conducted extensive interviews with Sales Agents and Wholesalers of the companies products across the four main regions: Northeast, Southeast, Midwest, West. We structured our interviews to be organized around who we interviewed (customer segment), details of their business, what products and services they provided and their feedback on our client’s performance. Approximately 50 pages of notes from these interviews were boiled down to the key VOC Inputs shown in Figure 1 below. We grouped these Inputs into seven key Affinities. These were the critical factors most important to the customer base.
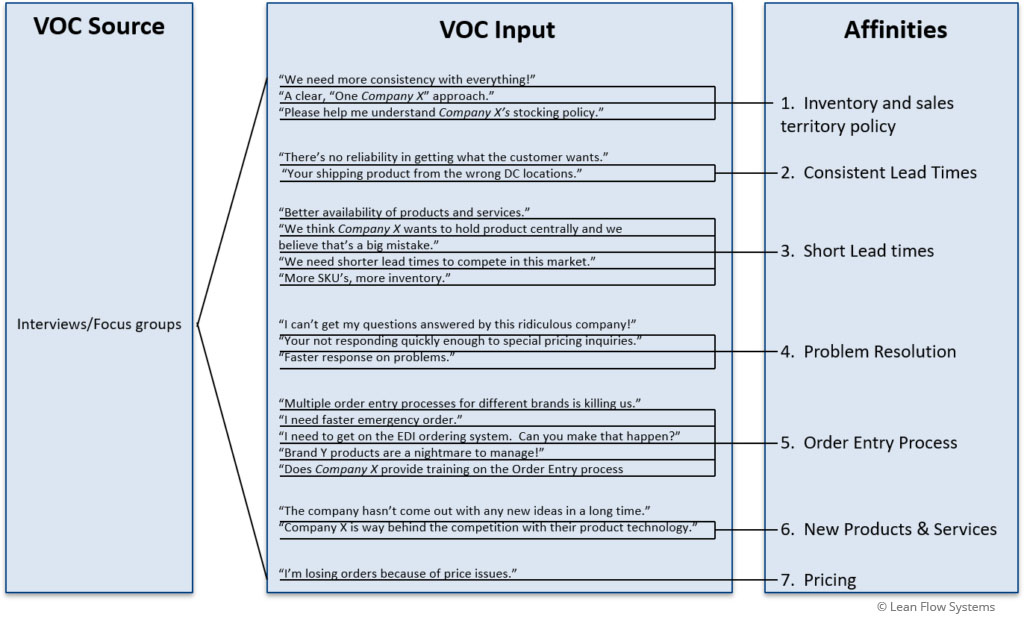
Figure 1
The next step was to develop more objective metrics and actions to take action on the Affinities and measure progress. To start this process, the affinities were converted into seven Critical Customer Requirements (CCR’s), Figure 2 below. These were the metrics to be used to measure progress in each area.
Behind the scenes, there was a great deal of discussion and analysis to arrive at the CCR’s. For instance, when it came to the subject of inventory stocking policy, we needed a methodology to determine the optimal inventory placement strategy since it would be cost prohibitive and wasteful to stock every part in every DC in the country. Therefore, an analysis was done that included the development of an Inventory Stocking Matrix and associated supply chain design. For more detail on this work, see “SUPPLY CHAIN EXAMPLE #2 – NETWORK DESIGN”.
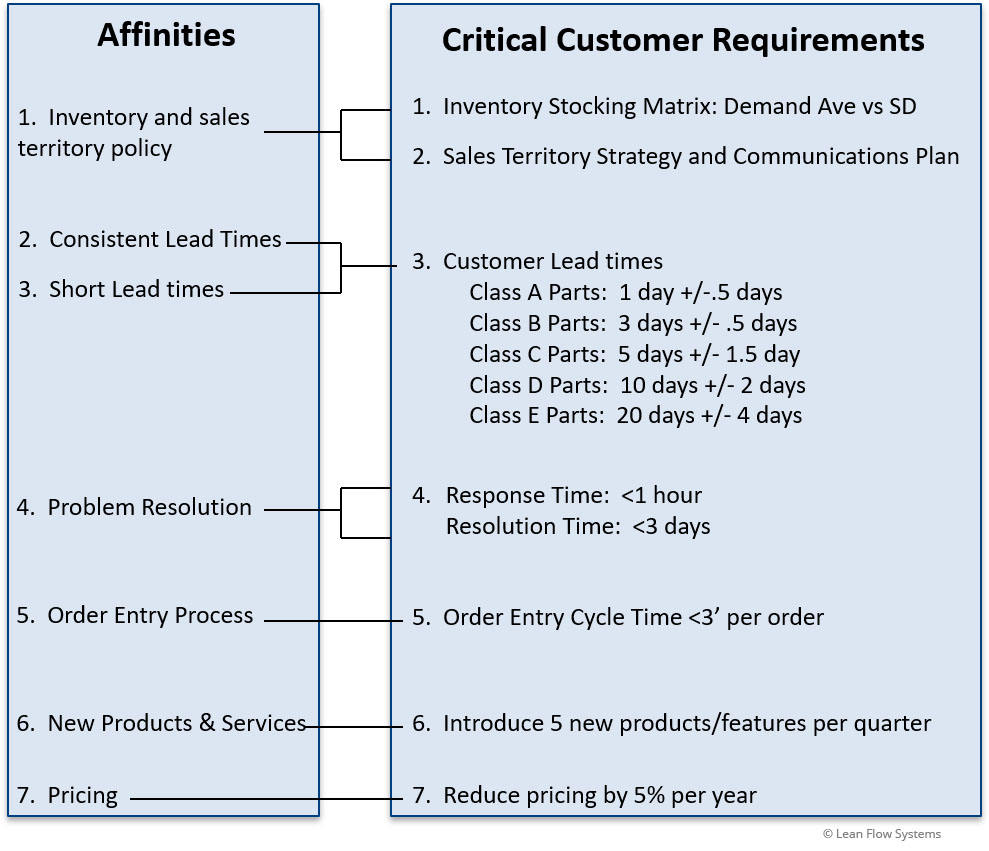
Figure 2
The next step was to prioritize which CCR’s to work on. One way to do this is using the Kano model. The CCR’s were plotted on a Kano Model (Figure 3 below) to get a visual on two parameters:
- How the team was performing on each CCR (Absent vs Fulfilled)
- The customers’ feelings on the companies performance (Dissatisfied vs Delighted)
The VOC led to the following insights for our client (note detailed metrics are omitted for proprietary reasons):
- Lead time expectations varied significantly by customer segment
- A poor inventory stocking strategy drove high transportations costs and split orders
- Large batch sizes in Manufacturing and Transportation crippled the companies ability to deliver broad selection with short lead times
- Pricing is important but there are bigger gaps to expectation on Delivery Lead Time and Problem Resolution Time
This analysis proved to be very valuable to the clients’ executive team and gave them more objective metrics to measure success against.
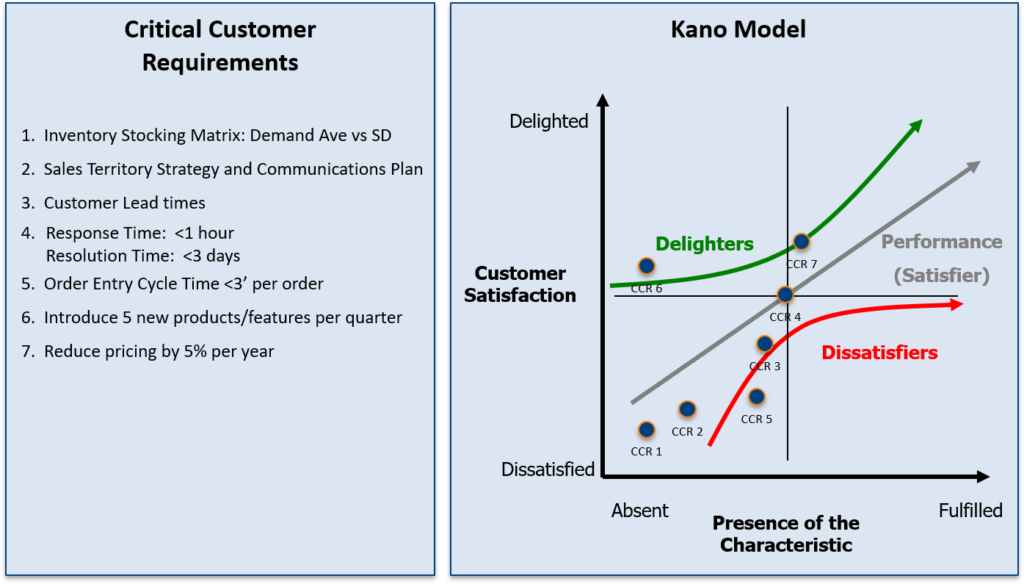
Figure 3
Flow Simplification Example
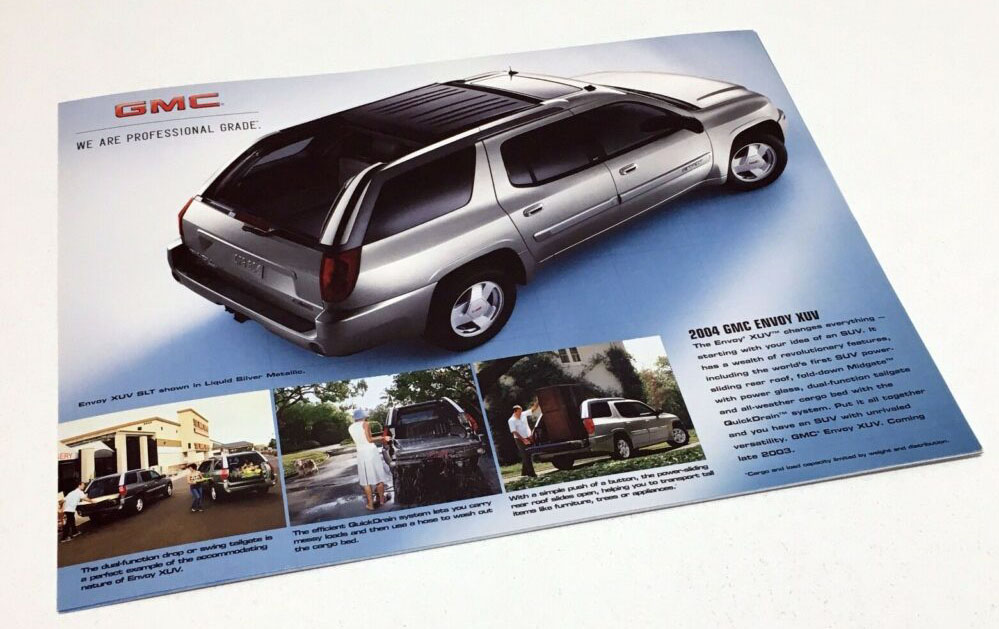
Figure 1 - GMC XUV
Background and Results
GMC introduced a new SUV model in 2004 that had a retractable rear roof section. It was called the GMC XUV, see Figure 1 above. It allowed the SUV to function as an open bed truck when needed.
Alcoa made the aluminum rails that the roof slid on when retracting. Figures 2 and 3 below show the left and right rail sets. The business making these rails was having trouble with quality, capacity and flow time through the manufacturing cell. One of the areas we worked on was flow simplification to increase capacity and improve quality. The results of the project yielded a 80% reduction in quality reject rate and a 50% improvement in capacity and material flow time.
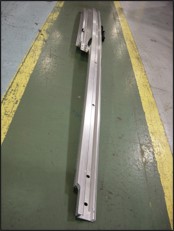
Figure 2 – Left Rail
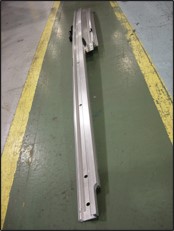
Figure 3 – Right Rail
Improvement Metrics

Flow Time 50% Faster

Capacity 50% Higher

First Pass Yield 80% Better
The Process
Figure 4 below shows how each step in the process changed the parts. It starts with 2 parts (long and short), that are assembled together to make 1 part, bent to match the contour of the roof, then cut in half to make the left and right-side roof rail sets. From there miscellaneous machining is done to add the product feature such as mounting locators.
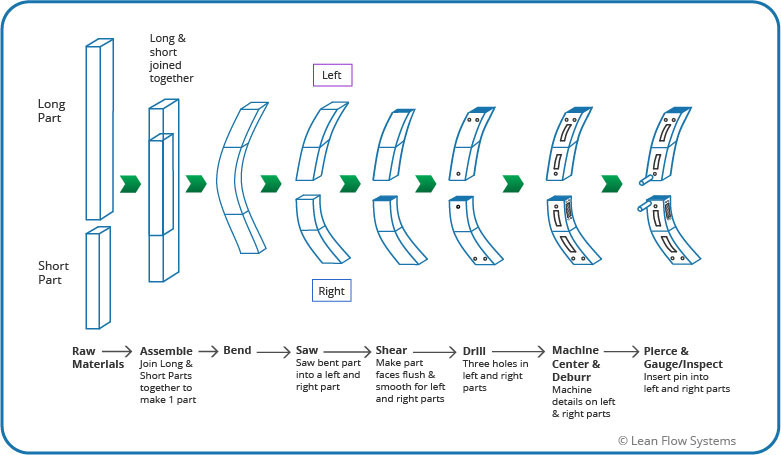
Figure 4 – Component Processing Steps
Flow Before and After
Figure 5 below shows the original and improved material flows. In the original complex flow, the left and right rails ran on any of the machines at each step in the process, causing complexity, confusion and delays in flow as parts waited at every step. Problems found in inspection were hard to solve to root because the issues were often machine-dependent. It was taking extra time and energy to discover which machines a problem part had run on.
We simplified the flow as shown at the bottom of Figure 5. After Saw, the left and right parts had their own set of dedicated machines to run on. This streamlined process was fast, efficient and made problem solving much easier.
However, there was one big problem we needed to solve. In the current state complex flow, three machine centers were required to have enough capacity for the product. This was a problem because one Machine Center would have to be shared between the two lines, thus complicating flow. To resolve this challenge we ran a Machine Kaizen Event. This event revealed a number of opportunities to increase capacity on the Machine Centers:
- There was excessive tool dwell time within the CNC program
- Tool changes were slow
- Feeds and speeds could be increased
We made improvements to address these problems and were able to get enough capacity to only need one Machine Center per flow line. The third machine center was sidelined for use on other products, thus saving capital equipment investment.
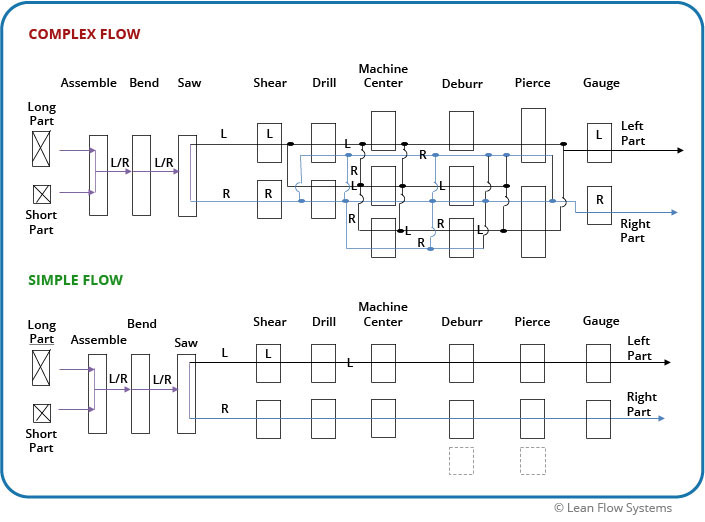
Figure 5 – Complex vs Simple Process Flow
Supply Chain Examples

Example #1 - Fulfillment Center Design
Background and Projected Improvements
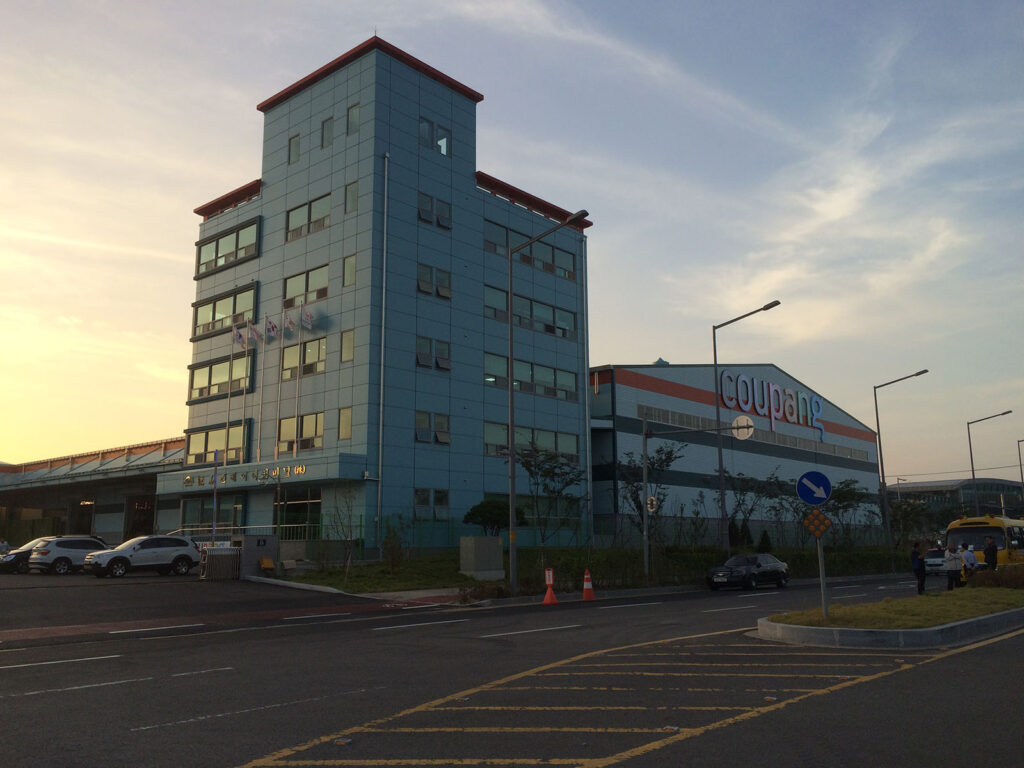
LFS was asked to help the leading eCommerce company in Korea, Coupang, improve its Supply Chain. This company dominated the market in its home country and was growing rapidly. Their Fulfilment Centers (FC’s) and Supply Chain Distribution channels were getting overwhelmed with demand and were wrought with waste and inefficiencies.
LFS came in and conducted a deep dive analysis of the companies operations with the goal of adopting a new business model to hold as many products as possible to serve their focused markets. Over a two month span network SKU capacity had to grow 66% and pick productivity had to increase 150%. At the time the company was operating 5 FC’s. LFS started with the largest FC to run improvement tests and build a model that would be cascaded to the other FC’s.
Improvement Metrics

Increase SKU Capacity 66%

Increase Labor Productivity 150%

Reduce Fork Truck Traffic
Poor Ergonomics
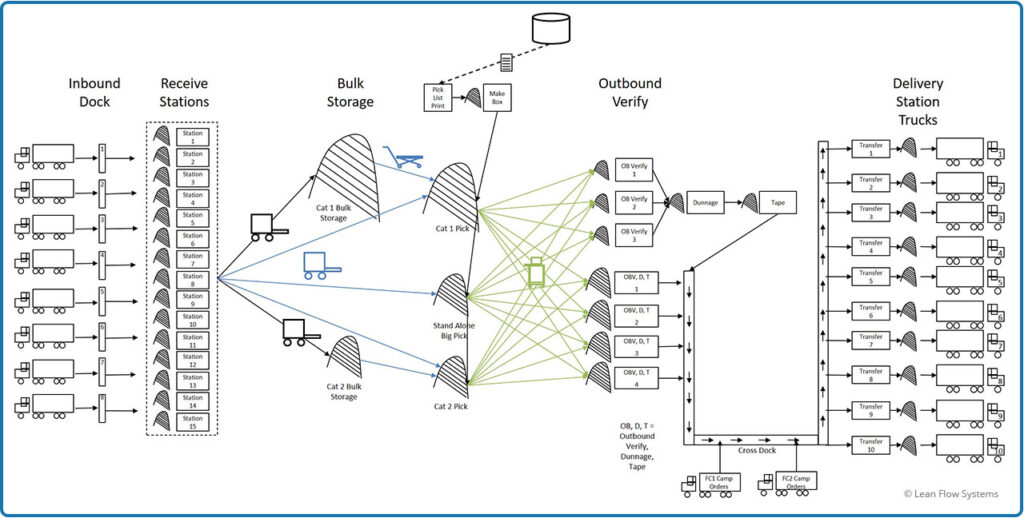
Figure 1 - Current State
Current State
Figure 1 above shows the current state material and information flow. A series of Receive Stations processed products coming from the Inbound Dock. This product was stored in a series of Bulk locations. Fork Trucks routinely delivered products to the Picking Areas. A team of pickers would get their pick tickets, walk to the box area, assemble their boxes and pick parts. These parts were delivered to Outbound Verify Stations to verify the product, add dunnage, tape the box and put the orders on a conveyor to be delivered to the Outbound Dock. Truck Drivers would transfer their orders to the dock floor until they had the majority of their packages, then they would load the packages on their trucks and drive off to their assigned Camp (eg. Depot Station).
There were a number of issues with this process:
- Pickers had considerable walking distance to get pick sheets
- Pickers spent time making boxes under poor ergonomic conditions
- Pickers constantly bumped into each other because workflow was not designed to be simple and linear
- SKU’s were not organized in the Pick Face
- No ABC classification analysis considered in the layout
- No flexible dividers to clearly delineate sku locations
- Replenishment times were infrequent, causing some sku’s to be overstocked and other sku’s to stock out
- There was a great deal of air (wasted space) in the pick face
- SKU affinities were not thoroughly considered in the layout
- There were frequent log jams at Outbound Verify, where large piles of orders would back up
- Drivers had excessive waste in the form of wait time and box rehandling
- There was no organization of the packages in the trucks, leading to long cycle times at the camps sorting products to the right delivery trucks
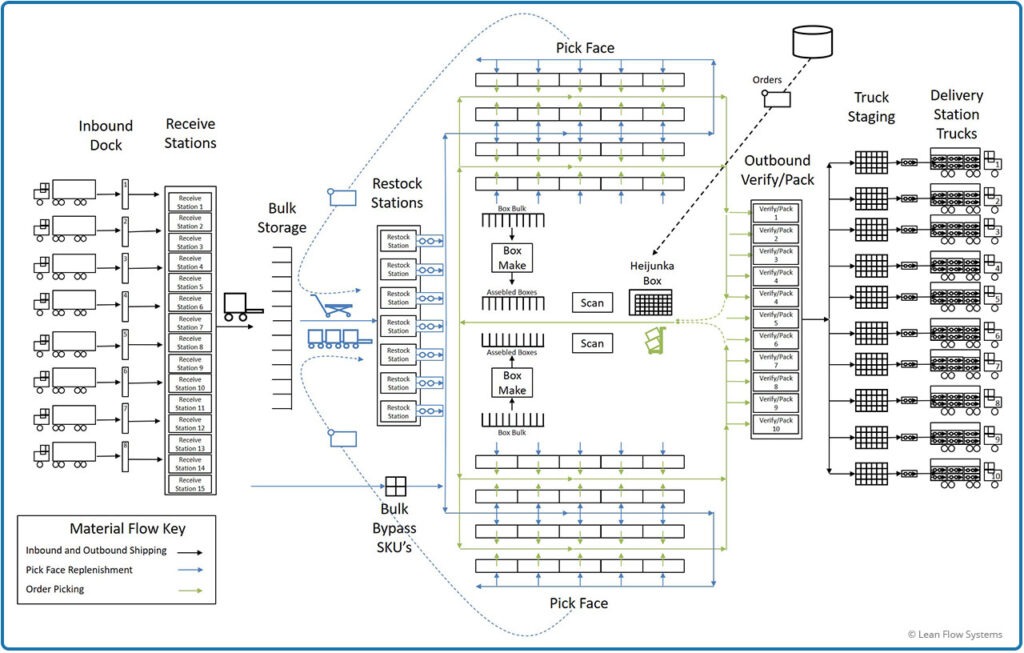
Figure 2 - Target State
Target State
Figure 2 shows the Target State design. This design resolved the issues identified in the Current State. Some of the features:
- Bulk Storage and Bulk Gold Zone to facilitate more frequent pick face replenishment
- Hand jacks and delivery trains rapidly replenish the pick face; this would reduce the space per sku, increase the pick face sku capacity and reduce picker walk time while also improving safety by greatly reducing fork truck traffic in the pick area
- ABC S/X analysis was used to better organize sku’s and utilize product affinities
- A Box Making Cell was implemented to eliminate picker cycle time and improve ergonomics
- A Heijunka box was used to level the volume and variety of picks; this allowed better visualization of ahead/behind, eliminated much of the picker bumping and allowed for better planning of picker staffing
- Multiple Outbound /Verify/Pack Stations would level out the load on this area and eliminated order backups
- Product was organized into rolling carts by camp and delivery truck to streamline delivery truck loading at the camps
Kaizen Events were organized and run to teach some of these lean tools and test improvement ideas. Following are some before and after photos and videos illustrating the improvements made.
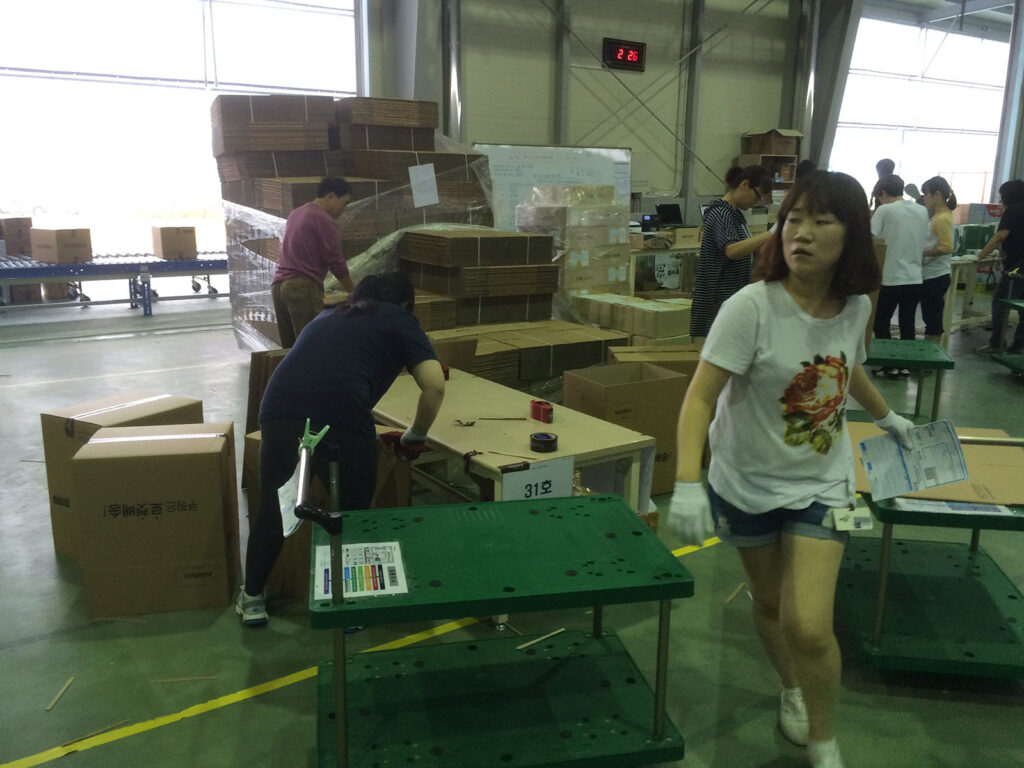
Figure 3 – Before Box Making
Poor Ergonomics, Time Consuming, Operator Bumping
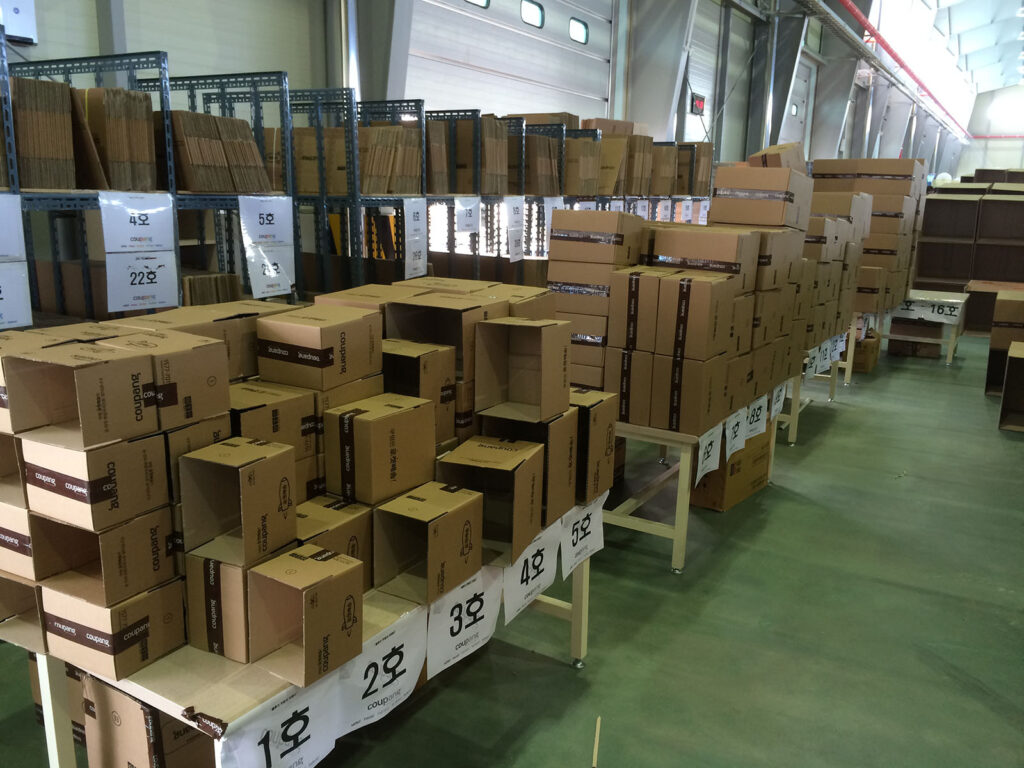
Figure 4 – After Box Making Cell
Ergonomic and Efficient
Before Video of Delivery Truck Depot
(VIDEO COMING SOON!)
Operators Waiting
Poor Ergonomics
Excessive Sorting
After Video of Delivery Truck Depot
(VIDEO COMING SOON!)
No Operator Wait Time
Better Ergonomics
Orders Sorted By Truck Into Cages
Example #2 - Network Design

Background and Projected Improvements
We were asked to do an end-to-end supply chain analysis for Watts Water Technologies, a leading manufacturer of water regulation and control equipment. The company was facing the dual challenge of shortening customer lead times and reducing inventory and transportation costs. They were plagued with frequent regional stock-outs and multiple line item shipments to complete an order. Their transportation costs were high because they often resorted to expensive 2 day UPS shipments across the country due to the stockouts to meet customer lead time expectations.
LFS started the engagement by conducting a Voice of the Customer (VOC) analysis (SEE VOC EXAMPLE for details). The key takeaways from the VOC:
- Unpredictable Leadtimes (inconsistent)
- Losing sales by not having stock (long lead times)
- Too many split shipments of orders
LFS’s deep dive analysis of the Watts supply chain resulted in the following observations:
Customer Lead Time Expectations
- Stock Orders: 3 days
- Emergency Orders: Same Day/Next Day
- Non-Stock Orders: 5 to 10 Days
Supply Chain
- Regional DC’s held only approximately 13% of the total SKU’s
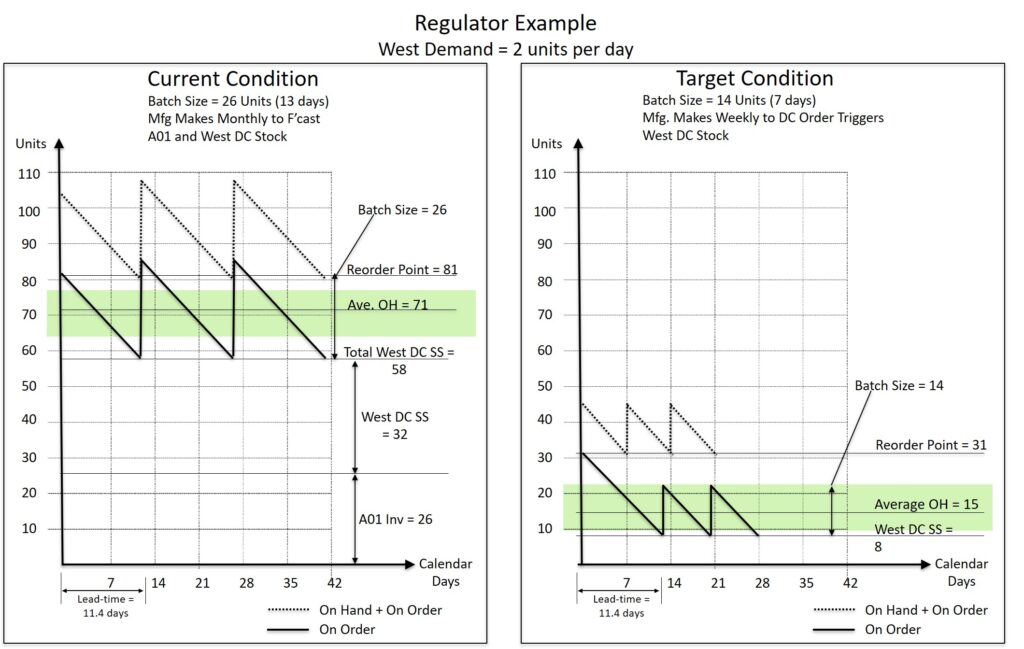
- Total network inventory turns was 3.0
- Inconsistent Stocking Policy – “Tug of War” between Watts and Agents on inventory
- Item ABC classifications and stocking policy in disarray
- Excessive inventory throughout the system driven by large batches/low-frequency replenishment
- Long manufacturing Changeover times (2.5 to 4.0 hours per part)
- Low-Frequency DC/Agent Replenishments (1x to 2x’s per week)
Distribution Centers
- Sub Optimal SKU layout
- Manual pick sequencing
- No Cross Dock Capability
- Blocked isles due to excessive inventory and early picks
LFS’s complete a target conceptual system design and did a deep dive analysis of the West Region DC. The estimated improvements by implementing the target design are summarized below.

Increase SKU Coverage by 58% (from 60% to 95%)
Reduce Split Shipments 50%
Reduce Customer Lead Time 50%

Reduce Transportation Costs 18%
Increase Sales and Market Share
National Analysis
To follow
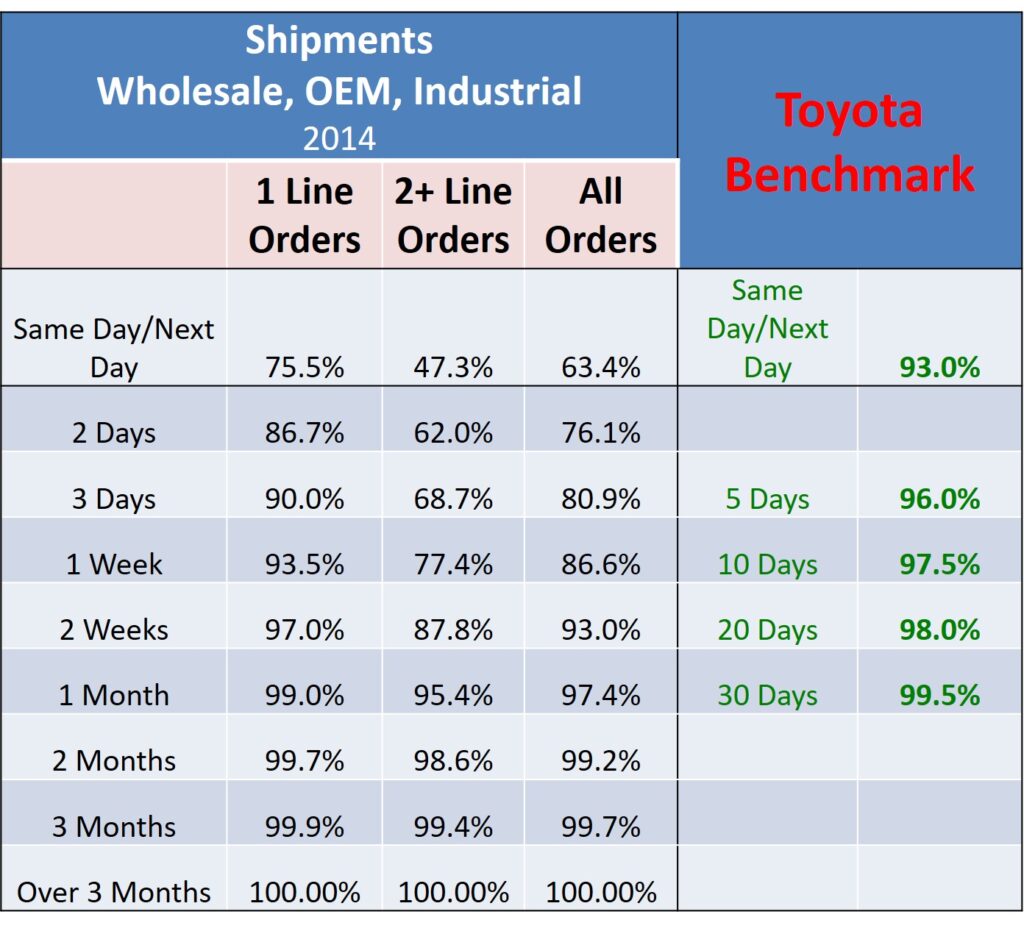
Figure 1 - Watts vs Toyota Benchmark Service Level
To Follow
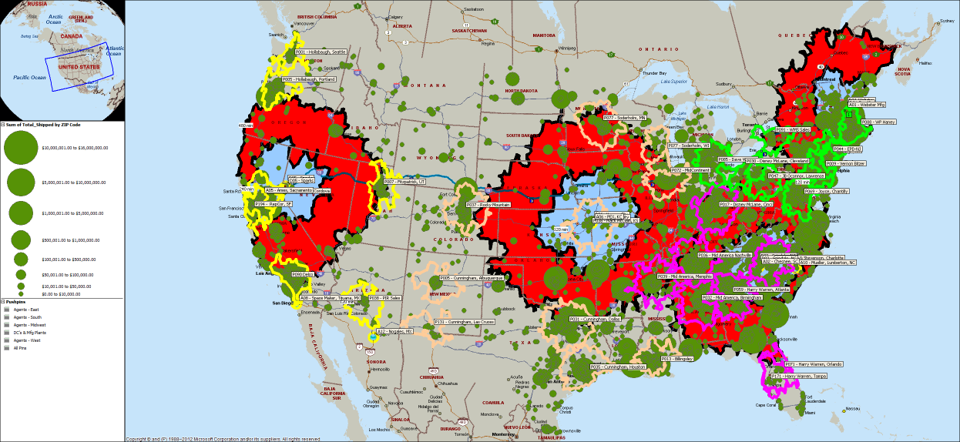
Figure 2 - Supply Chain Coverage
Network Flow – West Region
To Follow
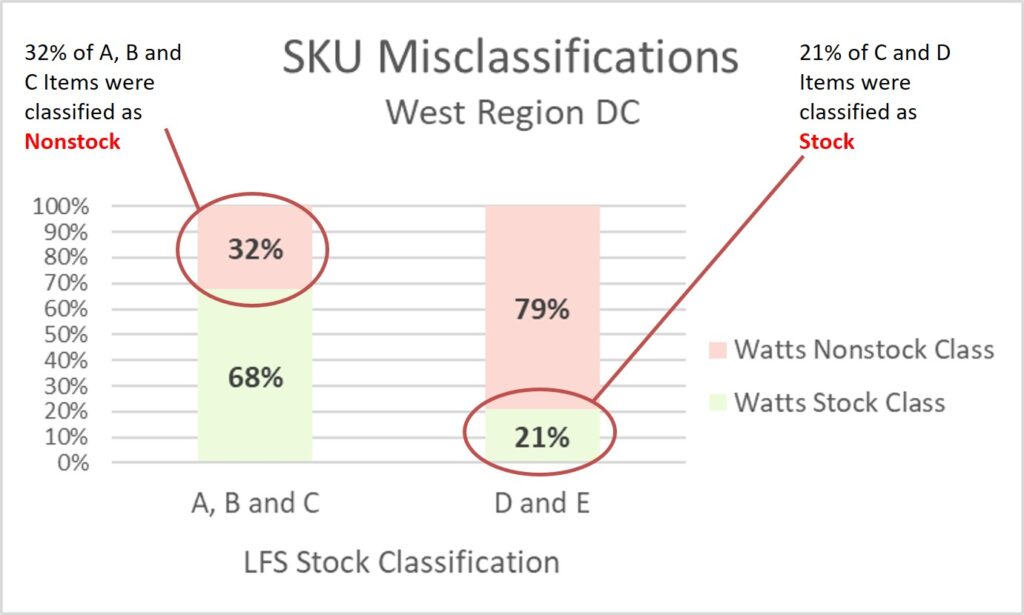
Figure 3 - Before (Watts) vs After (LFS) Classifications
To Follow
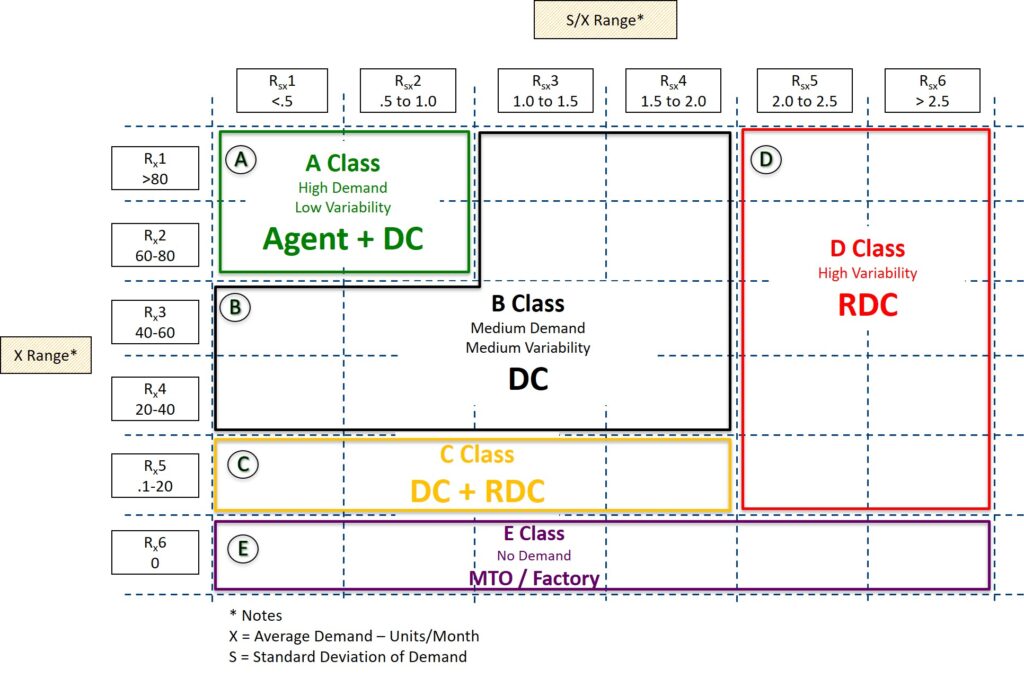
Figure 4 - New SKU Classification
To Follow
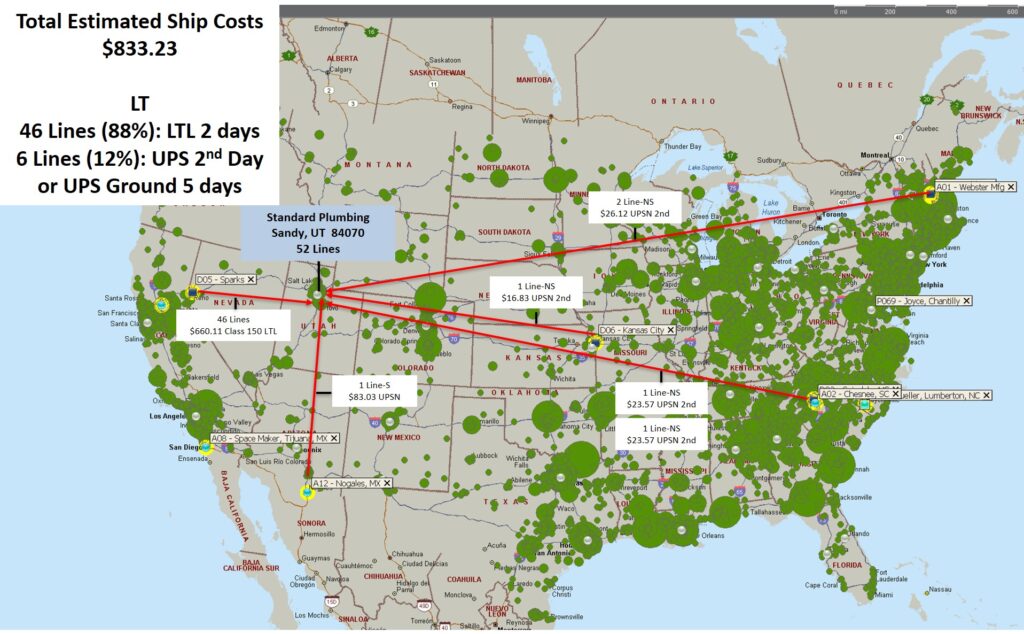
Figure 5 - Original SKU Classification - Shipping
To Follow
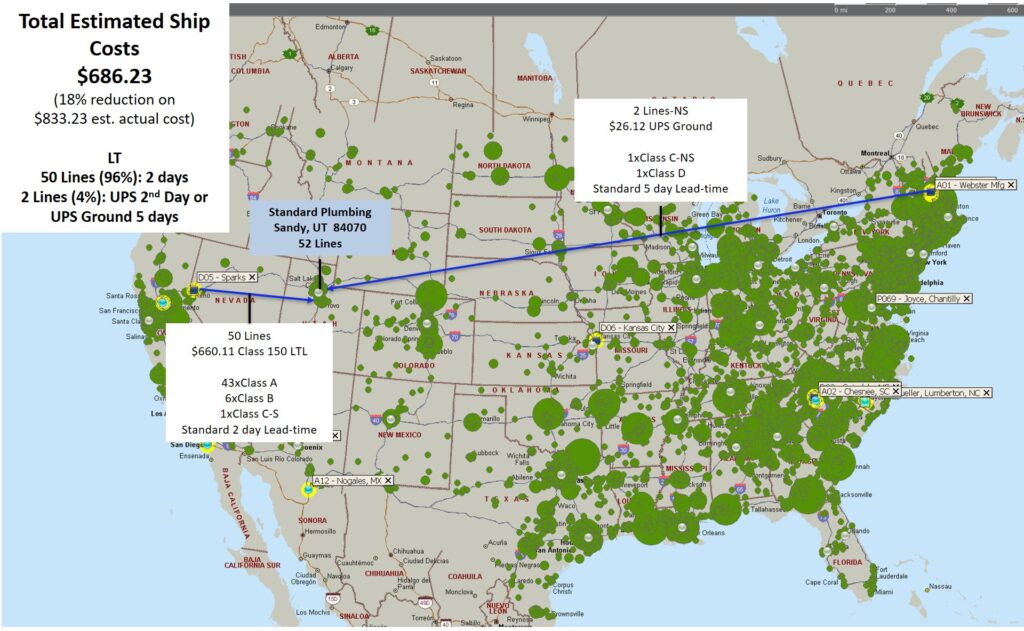
Figure 6 - New SKU Classification - Estimated Shipping
To Follow
