Home » Process
PROCESS DESIGN
Deep Dive
LFS dives deep into process design and develops model areas to teach the team, drive rapid results and construct the target system. As a result, waste is eliminated and a standards-based culture developed. Additionally, metric dashboards and visual indicators of process status are installed to measure performance to standard and provide feedback to the team when there are variations from targets.
We build processes that reveal problems close in space and time to their occurrence and engage the entire team in rapid problem solving.
Process Design Tools
There are ten key tools used when conducting a rigorous process design deep dive. These tools set the standards against which the problem-solving process is triggered. The tools address machine/equipment design, process flow, operator/employee work layout and demand scheduling. We assess your processes and teach your team the right set of tools to achieve your objectives.
- Change Over Reduction: Creating agility and flexibility to efficiently offer a broad range of products and services.
- Autonomation: “Automation with a human touch” – freeing people from babysitting equipment, automating processes and eliminating work steps.
- Machine Kaizen: Eliminating waste in equipment processing.
- Error Proofing: Making it impossible to pass errors and defects.
- Total Process Efficiency (TPE): A complete suite of efficiency metrics.
- Flow Simplification: Creating lean, efficient, continuous flows.
- Cell Design: Laying the workplace out to promote teamwork and continuous flow.
- Leveling: Smoothing out demand and supply signals to create stability.
- Pull System: Cascading the pulse of the customer through the entire operation via visual signals.
- Strategic Inventory: Rightsizing inventory to keep the operation running smoothly.
- Visual Standards: Making it easy to see when there is a problem.
Changeover Reduction
Creating Operational Agility
Long changeover times need to be reduced or eliminated as a prerequisite to providing great quality, superior flexibility, rapid delivery and broad offerings. Long changeovers drive big batches of the same product, making it cost prohibitive to deliver one by one customer orders. Big batches also drive very poor quality.
Changeover is the time it takes to transition from working on one product or service to working on a different product or service. Every business has it. In manufacturing it is also called Setup Time. For knowledge workers, it is called “Context Switching”, the time it takes to transition from one task to another.
There are three elements to changeovers that drive capacity losses, high inventory levels and inflexibility:
- Internal Changes – Time that the process is down while the team is transitioning to a new product/service.
- Adjustments – Time required to adjust the process, after the changeover is complete, to produce quality products/services.
- External Changes – Time spent preparing for a changeover while the process is running.
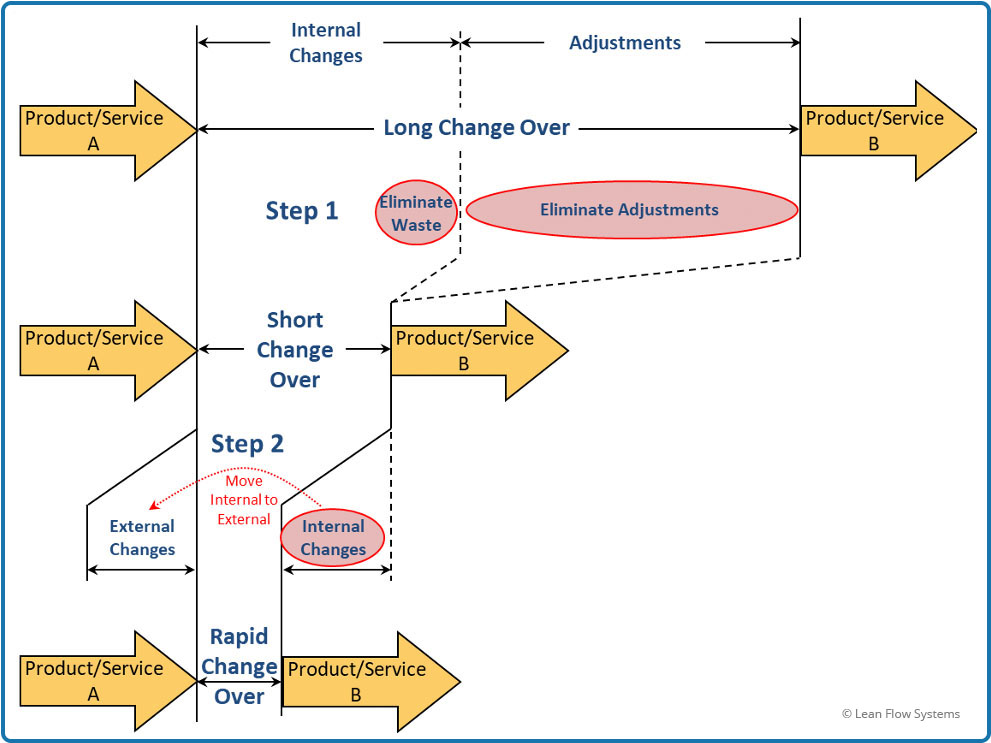
Change Over Reduction Steps
The diagram above illustrates the changeover reduction process. In this example, the process starts with a long changeover time between running products A and B, including significant internal changeover time. Furthermore, there is a long time period of adjustments to get the product running correctly with the right quality. The steps to reduce this time are as follows:
Step 1: Eliminate waste from Internal Changes and eliminate the time to make adjustments. Results in short changeover time.
Step 2: Move the remaining internal time to external time. Results in rapid change over time.
Autonomation
Automation with a Human Touch
Technology is a powerful tool when applied wisely and with careful consideration to the associate’s needs and work design. However, it is often misapplied or sub-optimizes one area of a process to the detriment of other areas.
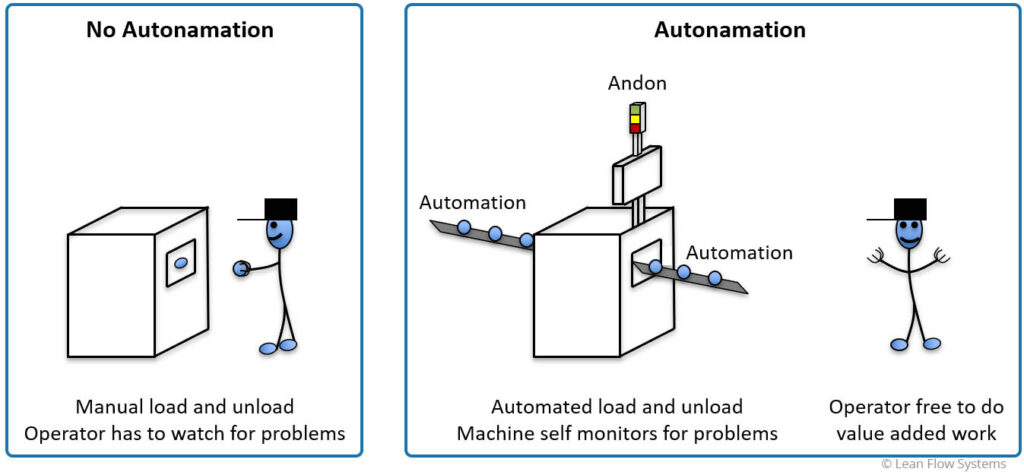
Autonomation is defined as “automation with a human touch”. It is the most efficient way to inject technology into an operation. First, people’s work is thoroughly studied. Second, equipment issues are clearly defined. Third, waste is eliminated in the process to ensure we don’t automate it. The technology self monitors the process and signals a problem via an Andon, making it clear to the operator when there is a problem.
Machine Kaizen
Technology Max Out
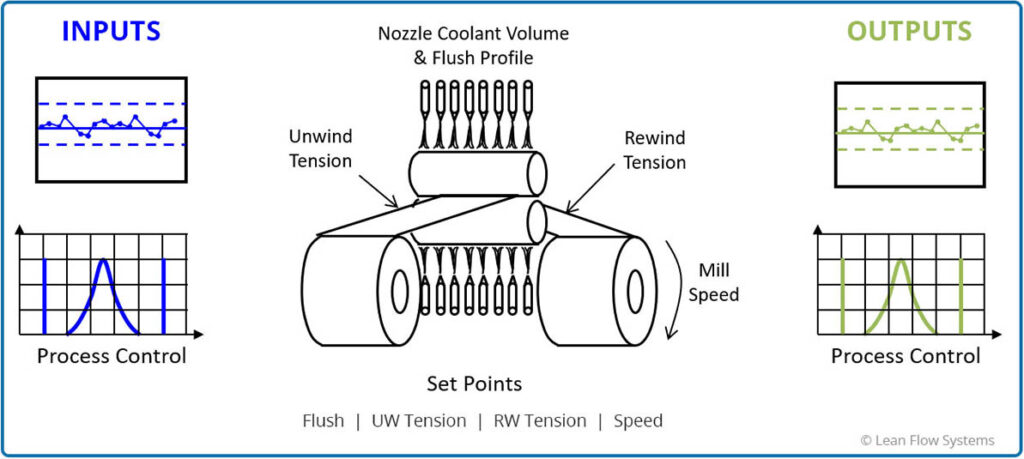
One of a companies biggest costs is capital, tooling and related technology. That’s why it’s critical that these investments efficiently operate at the highest levels. Machine Kaizen (kaizen means “improve” in Japanese) is the study, analysis and improvement of equipment. Inputs such as material quality and ancillary materials, for example, machine coolant and steel rolls in the rolling mill example above, also have a big impact on machine performance. Consequently, they are often included in Machine Kaizen. A useful methodology for organizing a Machine Kaizen is SIPOC:
S = Suppliers – The suppliers that are providing the Inputs.
I = Inputs – The actual Inputs – material, tools, etc…
P = Process – The equipment Set Points: speeds, motions, etc…
O = Outputs – The results of the process: Time, Quality, Cost.
C = Customers – The customers and their specifications for acceptance.
Error Proofing
Preventative Design
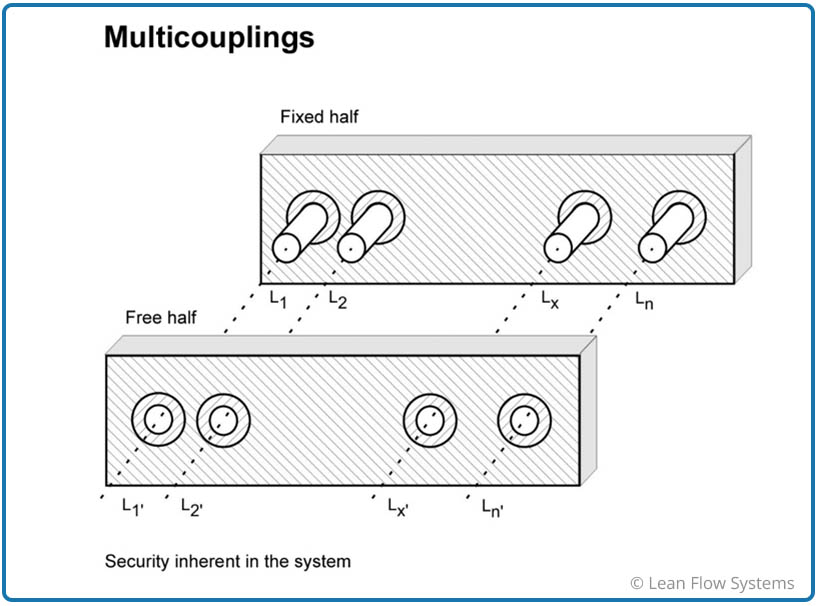
We live in a world where errors are a common part of life. People, for all their brilliance, get tired, lose attention and make mistakes. Error Proofing builds preventative design into a process so that it is impossible to physically move forward if a mistake is made. Following are some Error Proofing categories:
Multicoupling (see figure above) – Connections that will only mate up in the correct orientation (additional example: diesel and gas pump nozzles have different diameters that match the vehicle gas cap opening).
Field Qualification – Algorythms that ensure all fields are filled out before progressing to the next step (ex. filling out a job application form online).
Multi Matching – Make something be repeated correctly twice or more before continuing to the next step (ex. new password).
Kitting – Count out and sequence the correct number of items ahead of time to ensure the right quantity is being installed in the correct order – sometimes linked to automatic counting or weighing mechanisms to ensure the kit preparation is done correctly.
Light Curtain – Technology that ensures a part has been pulled (“positive break”) or a machine is shut down for safety (“negative break”).
Separation – Physical separation of an activation device from a dangerous source to prevent injury (ex. garbage disposal switch far enough away from disposal to ensure the person’s hand can’t reach it upon startup).
Total Process Efficiency
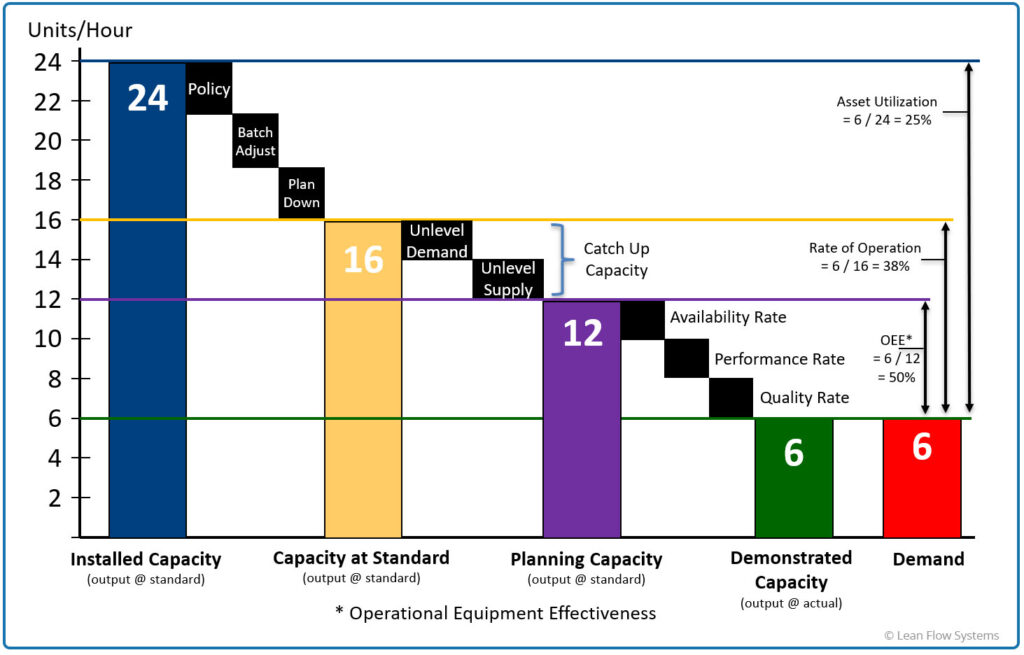
The Ultimate Metric
You get what you measure. And if your measurements are wrong or incomplete, your chances of success are greatly diminished. That’s where Total Process Efficiency (TPE) comes in. It is a comprehensive set of metrics for measuring the efficiency of a resource. TPE is “airtight”, meaning there is no ambiguity in the measurements and no potential losses that wouldn’t be caught.
While the metric has been most frequently used in equipment maintenance circles, it can be applied to other areas such as cell efficiency or people’s work.
Flow Simplification
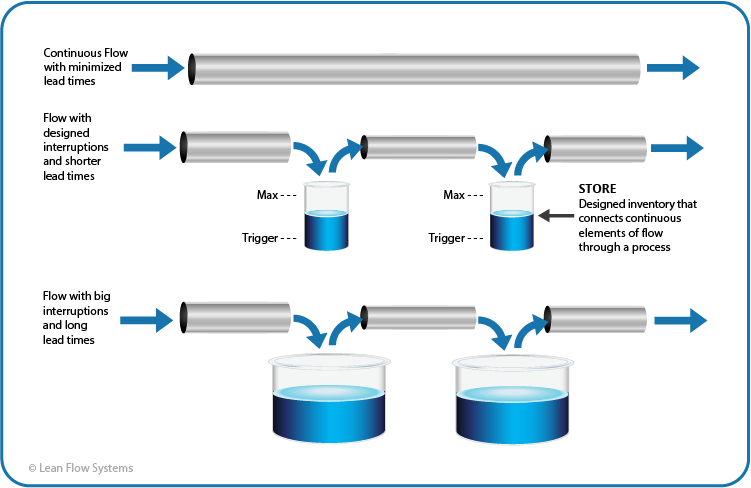
Speed Merchant
Everyone wants everything fast today. Products and services that continuously flow through your business acheive the speed needed to beat the competition to the punch.
Water flowing through a network of pipes is a good way to think about your product and information flows. Current state flows typically have big interruptions throughout the process where inventory and backlog build up – as shown at the bottom of the figure. As a result, lead times are long and highly variable, making it difficult to predict when a customer will get their product/service. Consequently, a heavy burden is placed on your team to constantly adjust schedules and plans.
The first goal is to create flow with designed interruptions such as inventory stores, queues and staging areas. These countermeasures provide design and stability to the business, as illustrated by the middle flow in the figure. From this state of relative stability, it may be possible to remove some of the designed inventories as processes are improved. This results in a more continuous flow that drives superior quality, lower costs and faster delivery.
Cell Design
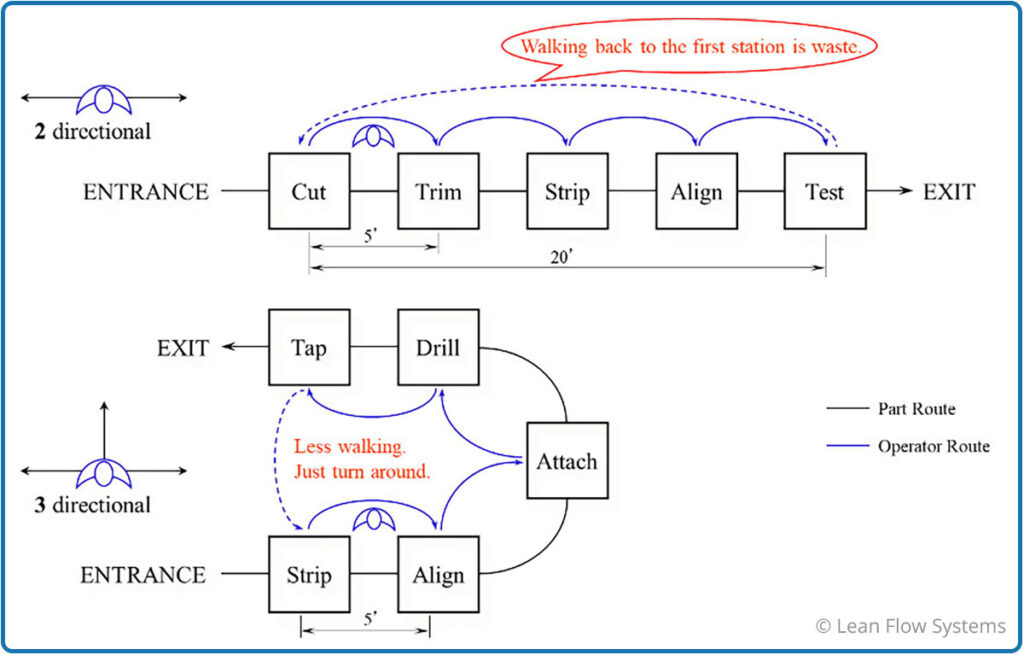
Driving Teamwork and Flexibility
Cell Design is a powerful tool to physically layout your workspaces. There are many advantages to good cell design:
- Controls the entry and exit of work into a process, controlling inventory and stabilizing flow time.
- Minimizes waste: walking, material handling and waiting.
- Enables flexible manpower to handle demand variability.
- Promotes effective communication.
- Provides degrees of freedom to share work.
- Allows teammates to quickly help each other.
A common mistake is to put processes in a linear line as shown in the top part of the diagram above. This causes excess walking and reduces the degrees of freedom to efficiently divide work up between the team and balance to takt time. The bottom part of the diagram shows a more effective U-Shaped configuration.
Leveling
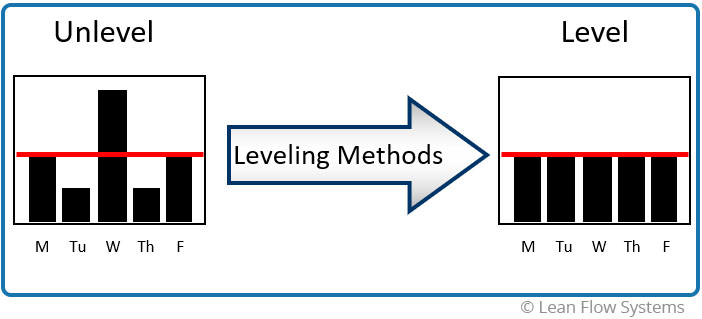
Eliminating Unevenness
Variability is terribly disruptive and drains an organization of energy and confidence. It is one of the greatest drivers of waste because it forces businesses to hold extra resources, causes late shipments, breaks reschedules and wears people and equipment out. Furthermore, variability is one of the least appreciated and understood causes of waste in a business and is notoriously difficult to measure accurately and assess the damage from (SEE DATA ANALYSIS EXAMPLE for a detailed case study on accurately measuring variability).
Tackling variability is not an easy task, but there are some powerful tools and methods to tamp it down. It typically starts with smoothing the incoming demand signal as shown in the diagram above. It also encompasses building consistent and paced work standards that match up to the leveled demand signal.
Leveling is one of the most advanced and powerful tools in the Lean arsenal!
Strategic Inventory
Engine Oil
Inventory in a business is like oil in an engine: too much and the business smokes and runs rough, too little and the operation “blows up” due to excessive friction. Too much inventory drives waste in extra handling, extra storage space, poor cash flow and extra time to schedule and manage it. Too little inventory causes late shipments, poor labor productivity, low equipment utilization and terrible customer service.
It’s not surprising, considering the heavy price to be paid on either side of the inventory ledger, that there is so much energy put into managing it! There is another way of viewing inventory: as a tool that can be right-sized and used as a trigger to solve problems and improve the business. This is strategic inventory.
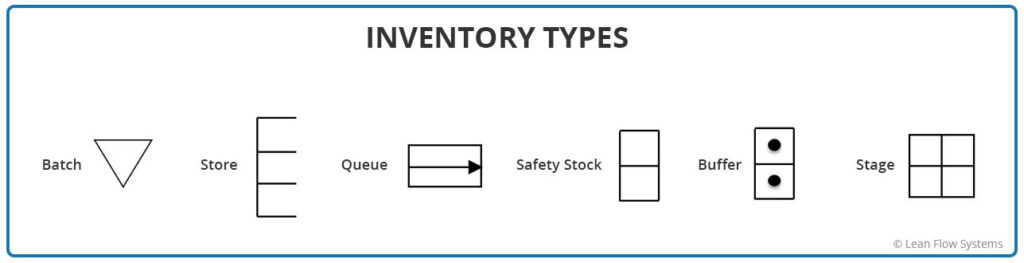
The goal is to have the right amount of inventory, in the right place at the right time. It can be sized through system design and analytics, categorized and monitored so you know exactly why you have the amount you have. The diagram above shows some examples of inventory classifications.
Pull Systems
Cascading Customer Pulse
Everyone in the business should feel customer need. We call it “tensioning the customer demand signal” through the operation. Pull Systems accomplish this by visually cascading the customer demand signal through the value stream.
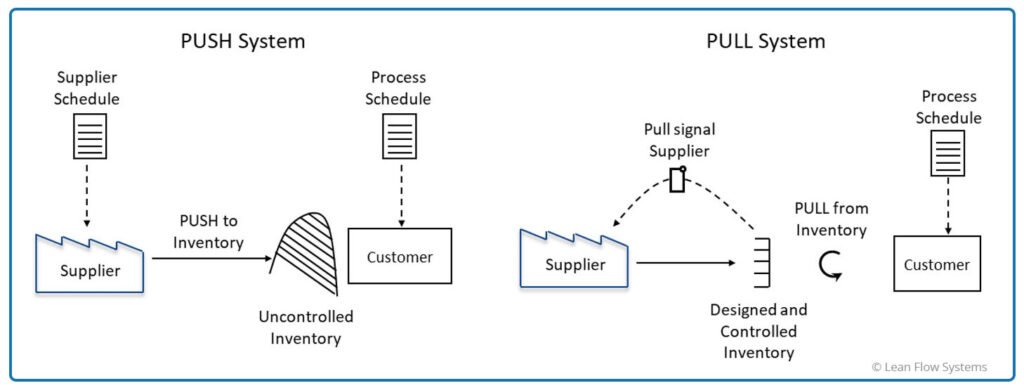
A PUSH system schedules the release of work base on demand forecast, resources and inventory on hand. Variability in demand and supply quickly renders these schedules obsolete. This results in excess inventory, long process flow times and confusion. The team loses touch with customer needs and expectations.
A PULL system authorizes the release of work based on system status – the downstream customer signals the upstream supplier when products or services are needed. The entire flow path is more in tune and linked to the needs of their customer. Everyone pulls in the same direction!
Visual Standards
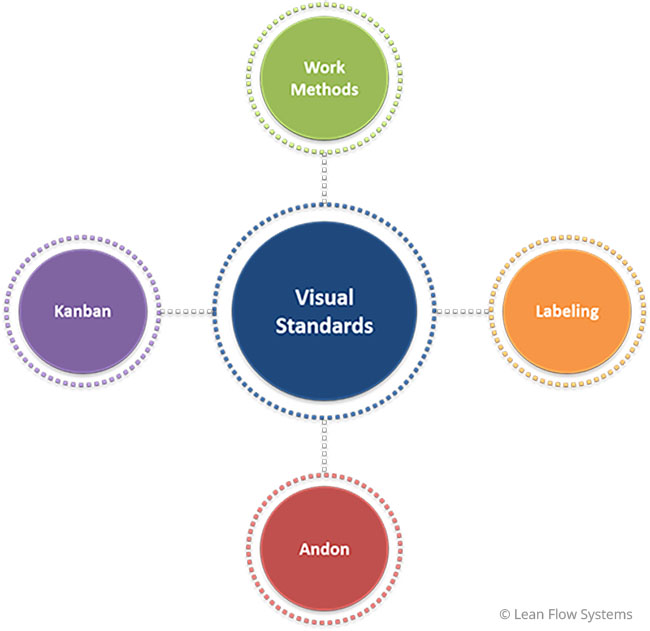
The Holy Grail of Culture Change
You want your entire team pulling together and improving their processes every day. This is the holy grail of culture change. It is infinitely easier to do when they see problems close in space and time to their occurrence.
The key elements of process design are used to eliminate waste, unevenness and overburden while also establishing standards to measure performance against. We want these standards to be as clear and visual as possible so we can measure and display, in real-time, performance gaps to them. This is a critical building block to great learning cultures.