There are ten major tools used when conducting a rigorous process design deep dive:
Change Over Reduction
Autonomation
Machine Kaizen
Error Proofing
OEE
Flow Simplification
Cell Design
Leveling
Pull System
Strategic Inventory
This suite of tools address machine/equipment design, process flow, workplace layout, employee work standards and demand scheduling.
Change Over Reduction Example
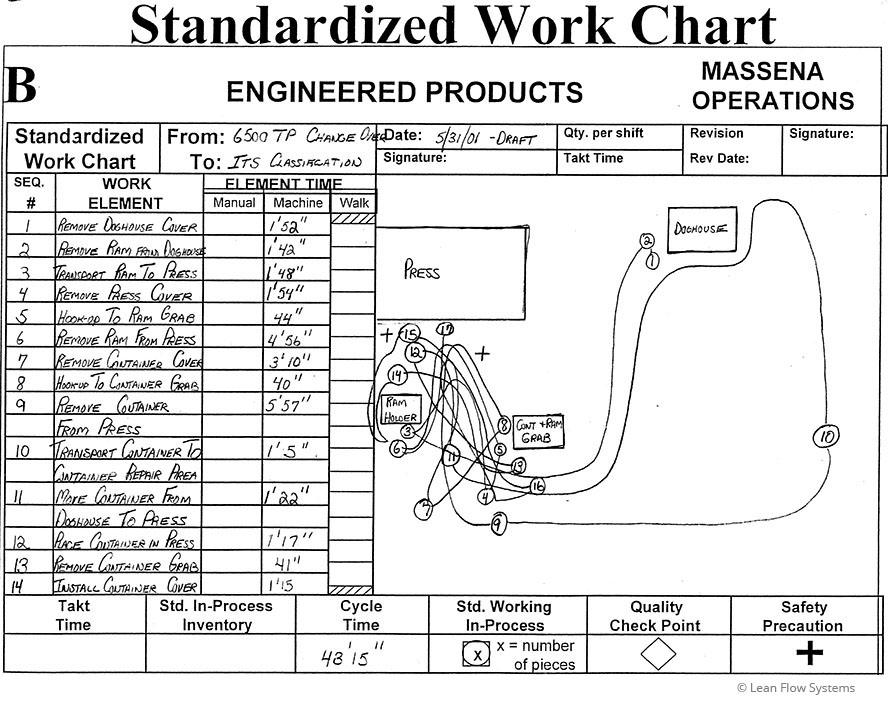
Large Extrusion Press – Background and Results
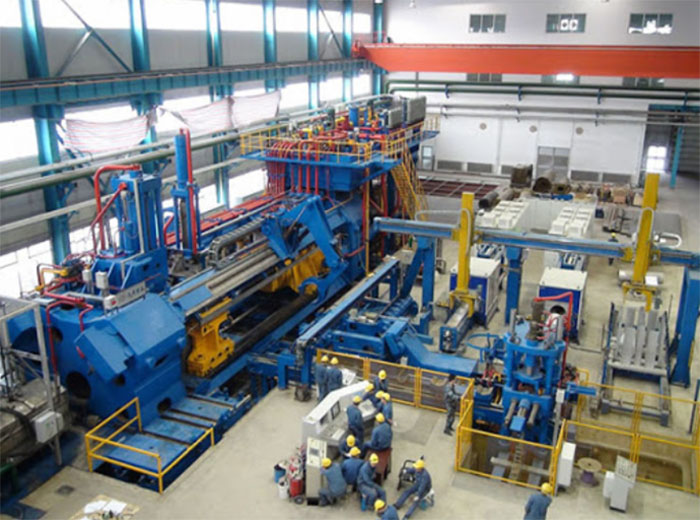
Aluminum extrusion presses are massive, complex and dangerous to operate. They take large, cylindrical ingots ranging in diameter from approximately 4” to 46” and can extrude them down to 1” or less. It takes a lot of time and manpower to change a press over from one size ingot diameter to another. The picture to above shows the layout of a typical large press.
The Change Over time for a large press we worked on was averaging 90 minutes and required 6 operators. A Change Over Reduction Kaizen Event was run for 3 days. We were able to cut the change over time in half (90’ to 45’) and only needed 3 people. We incorporated safety standards, rebalanced work and synchronized the operators to eliminate wait time. We moved work elements from internal to external to minimize the amount of time the press was down. These improvements increased press capacity and improved flexibility to better service the customer.
Improvement Metrics
Change Over Time Reduced 50%
Change Over Labor Reduced 75%
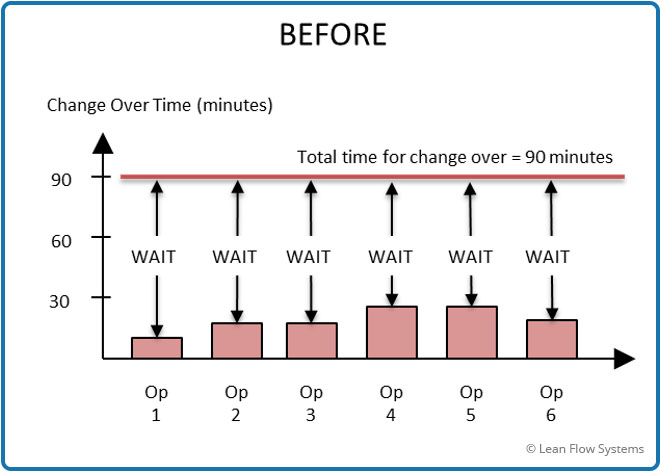
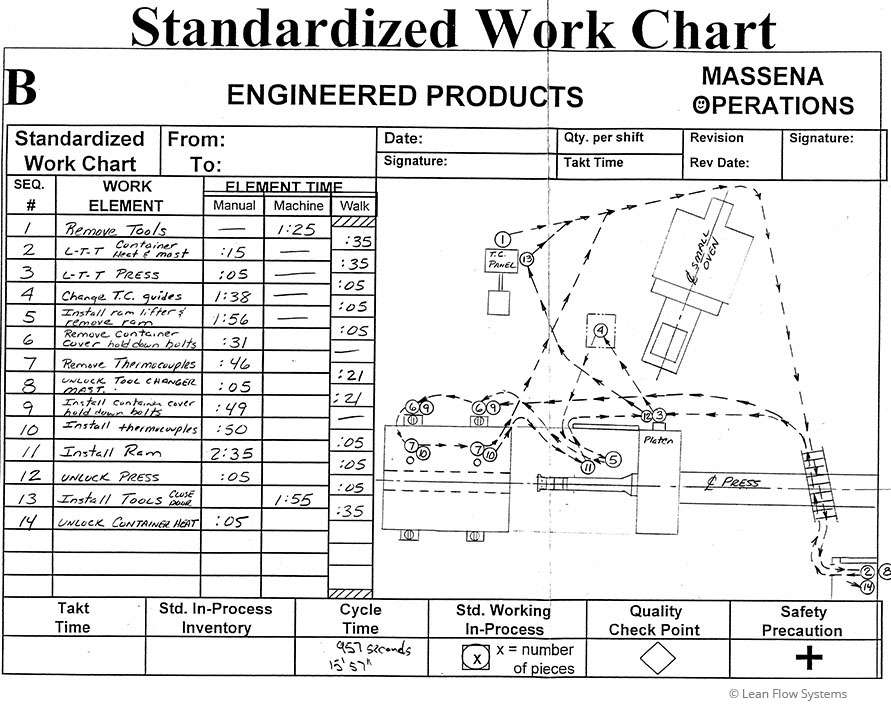
Figure 1 - Work Balance Before
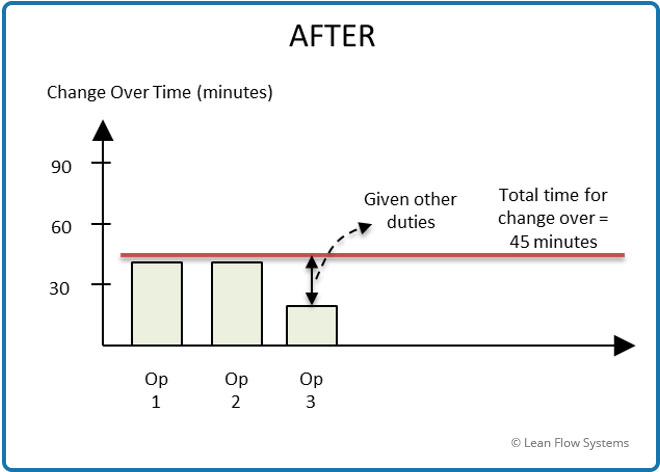
Figure 2 - Work Balance After
Labor Balancing
In the current state it was observed that the six operators frequently waited on each other to complete tasks as shown in Figure 1 above. The work was haphazardly divided up between people based loosely on seniority and general experience.
After work was rebalanced (Figure 2 above) two operators were fully utilized with little waiting. The third operator had only 16’ of work on the changeover, so they were given additional duties moving materials for another press.
Click for Larger View of Press Side Operator
Press Side Operator
Click for Larger View of Die Side Operator
Die Side Operator
Click for Larger View Fork Truck Operator
Fork Truck Operator
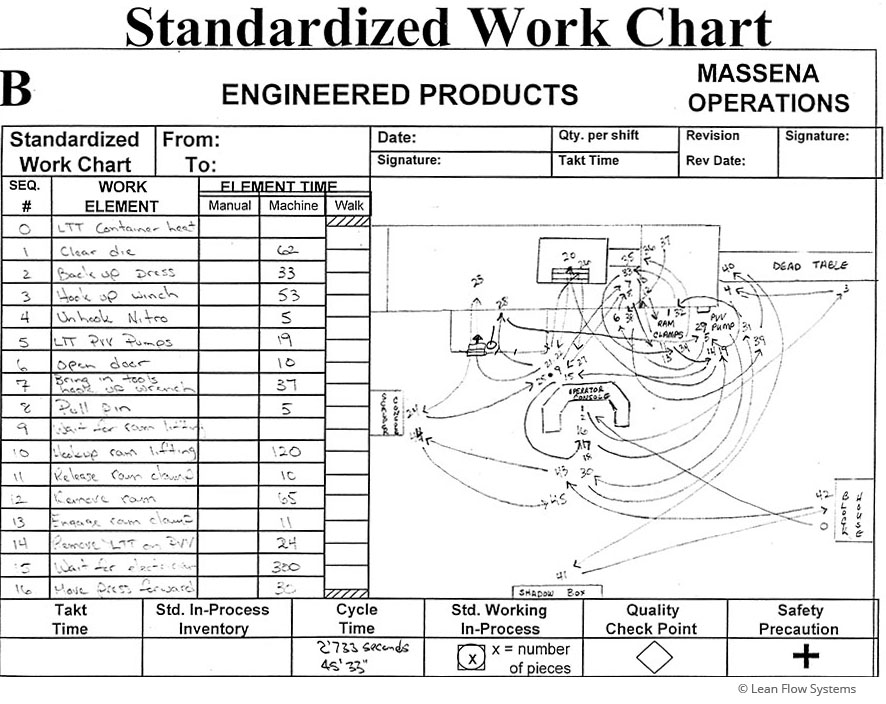
Standard Work
This is an excellent example of how much waste can be taken out of a process if you dive deep into understanding the work of the team. Above are the three Standard Work documents developed for the three operators (note that this is a sample of the standard for each operator, not all process steps are shown). The work of each person is documented, including sequence, time, content and location. With these standards in place we were able to measure ahead/behind for each operator during change overs and note deviations from the standards.
Error Proofing Example
Ship to Light
Shipping Rx Glasses – Background
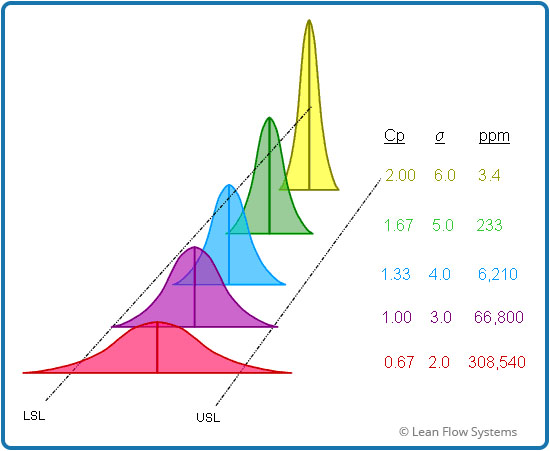
Our client, Essilor, the global leader in ophthalmic lenses, was having a problem shipping completed prescription glasses to the wrong Eye Care Practices (ECP). On a typical day a medium size lab will ship 2800 orders to 500 different ECP’s. All these shipments are via parcel, typically UPS or a local carrier. One lab was averaging 5 miss shipments per day, for a defect rate as follows:
5 errors per day / 2,700 orders per day = .185% = 1,850 parts per million (ppm)
This may not sound like a lot, but it is less than 5 sigma for a very simple process – “put the order in the correct box”. And it causes a great deal of customer angst and operating costs to fix. Figure 1 below shows the ppm for various sigma ranges.
Improvement Metrics
Reduce Shipment Errors 70%
Reduce Parcel Shipping Labor 15%
Figure 1 - Sigma versus Parts Per Million
The two major reasons for the shipment error were as follows:
Batch Printing of Invoices – estimated to be 20% of the shipment errors, 1 order per day
Putting the order in the wrong shipping box – estimated to be 80% of the shipment errors, 4 orders per day
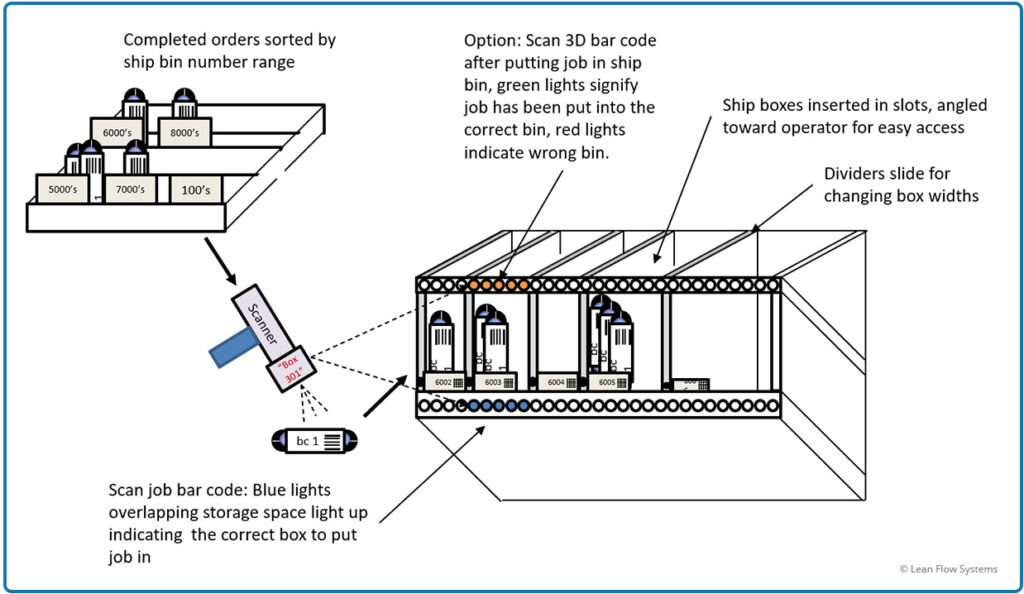
We were already testing a solution for the first reason by invoicing orders one by one in the finishing cells, and it was reducing this source of error. But we had no solution for the second reason. That is when we decided to design and test a “Ship to Light” concept.
Figure 2 illustrates the basic design. Orders come from the cell presorted into shipping bin ranges (for example, all ship bins 5000 to 5999 put together). The operator then scans the barcode of each job and a series of lights indicate the slot to put the job in. A similar concept was benchmarked at another lab that had made shipping accuracy improvements.
Figure 2 - Ship to Light Concept
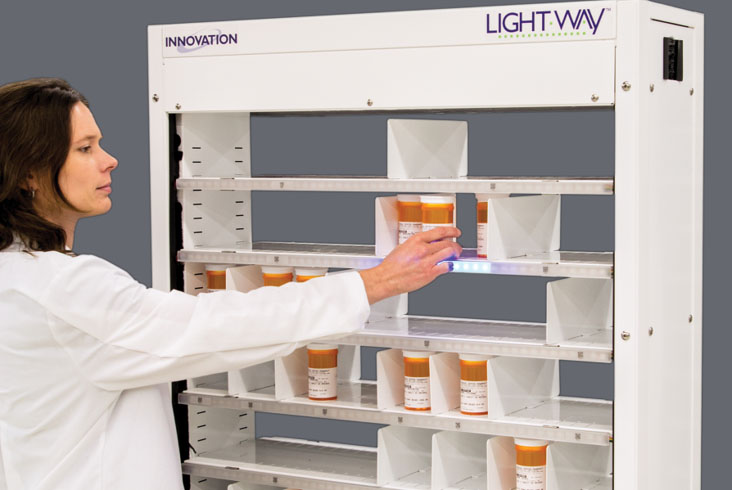
Figure 3 shows a similar ship to light technology available off the shelf. Figure 4 shows a typical “Pick to Light” technology used in Fulfillment Centers.
Figure 3 - Ship to Light Example in Pharmacy Industry
Figure 4 - Pick to Light Example in Supply Chain Industry
Cell Design Example
Process and Results
We were called in to improve Essilor’s lab operations. A System Design analysis revealed complex flows, long flow times, high rework rates and low labor productivity. We decided that the first step to improving the lab was to design and test out a continuous flow cell with Standardized Work, Pace and Process Control.
Improvement Metrics
Order Flow Time Reduced 79%
Labor Productivity Increased 131%
Material Handling Reduced 81%
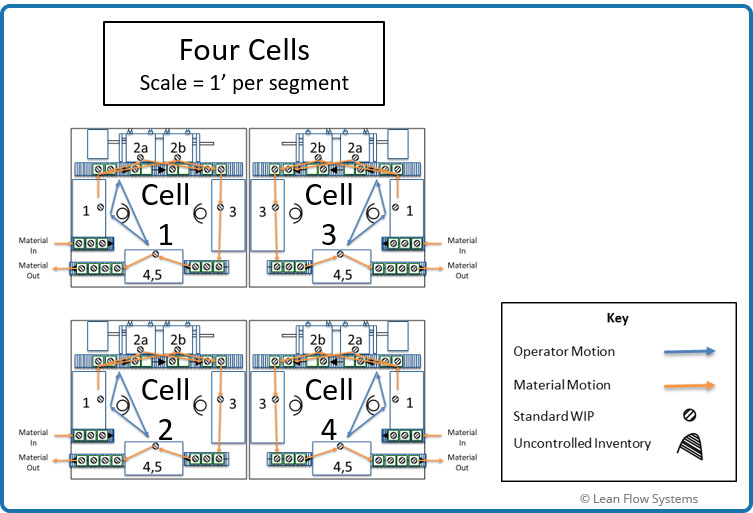
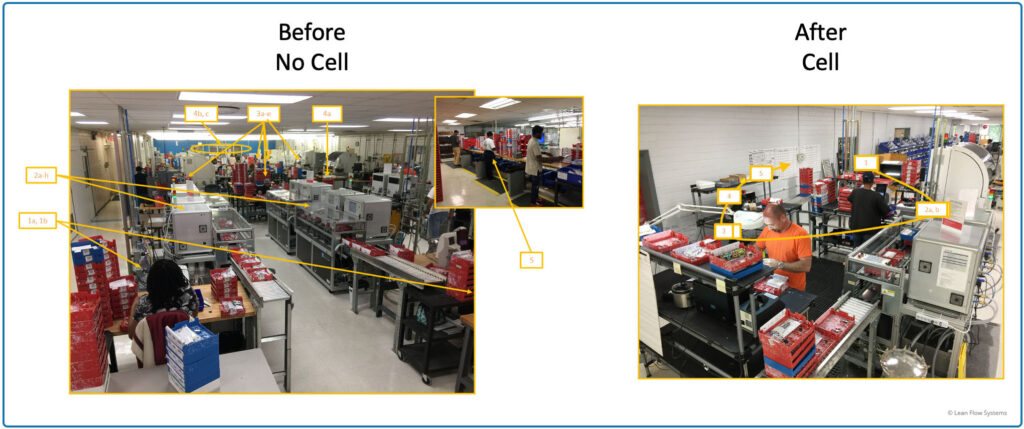
Current and Target State Designs
The current condition material flow and operator motion are shown in Figure 1 below. There were many material start/stop points, complex flows and operator idle times. Inventory pooled up in many locations. Operators only did one type of work and were very inflexible. In the Target Design (Figure 2 below), material continuously flows one by one through a U-Shaped cell with minimal material handling and operator motion. Figure 3 shows pictures of the Before and After layouts.
The results of this first test were:
Built-In Quality
Increased first pass yield
Quality right the first time
Standardized Work
Balance work to target takt time
Pace all processes to bottleneck
Work to reduce bottleneck cycle
Cross-trained and more flexible operators
Fast response to problems
Understand the issues in real time to help problem solving
Better quality, lead time, efficiency and cost
Increase customer satisfaction
The success of this cell led to a complete lean transformation at the lab and a nationwide initiative to transform 20 more strategic labs across the country. See “EXAMPLE OF STRATEGIC PLANNING AND DEPLOYMENT” for more details on how the initiative was planned and implemented.