Figure 1, ___
An integrated, world-class operating system that delivers your offerings seamlessly across all of your markets is the ultimate vision. But there are many challenges and complexities to successfully linking service and manufacturing operations to the delivery network. Supply Chain Design extends the System Design building blocks of VOC, Flow Simplification and Value Stream Analysis across your entire delivery enterprise.
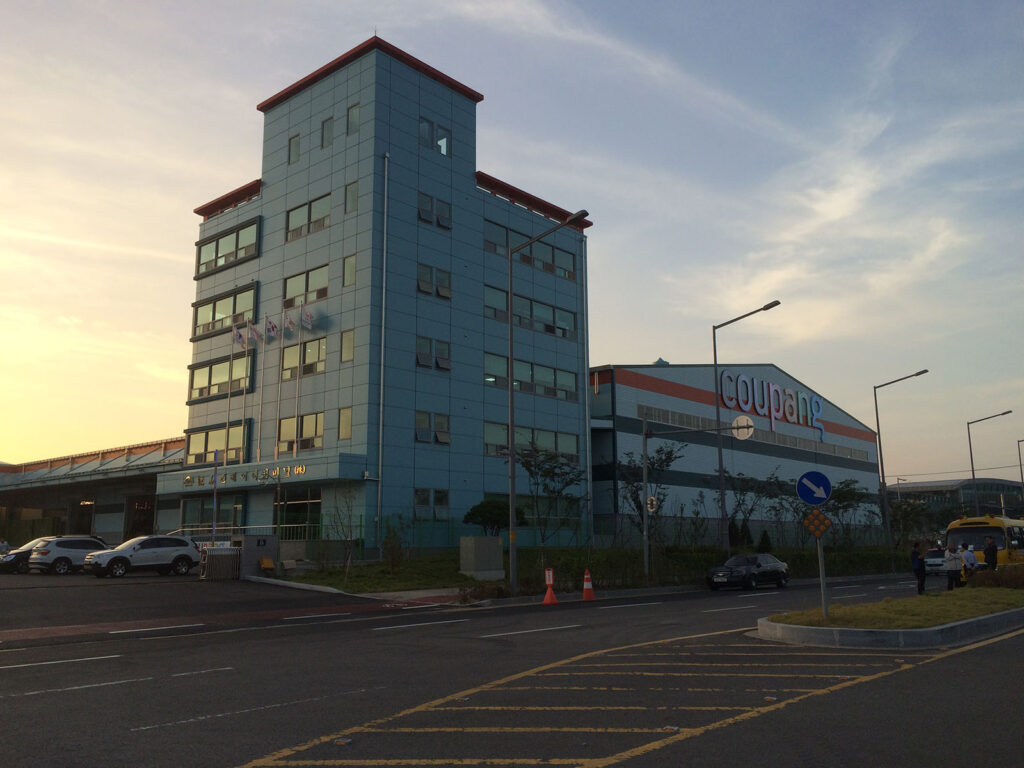
LFS was asked to help the leading eCommerce company in Korea, Coupang, improve its Supply Chain. This company dominated the market in its home country and was growing rapidly. Their Fulfilment Centers (FC’s) and Supply Chain Distribution channels were getting overwhelmed with demand and were wrought with waste and inefficiencies.
LFS came in and conducted a deep dive analysis of the companies operations with the goal of adopting a new business model to hold as many products as possible to serve their focused markets. Over a two month span network SKU capacity had to grow 66% and pick productivity had to increase 150%. At the time the company was operating 5 FC’s. LFS started with the largest FC to run improvement tests and build a model that would be cascaded to the other FC’s.
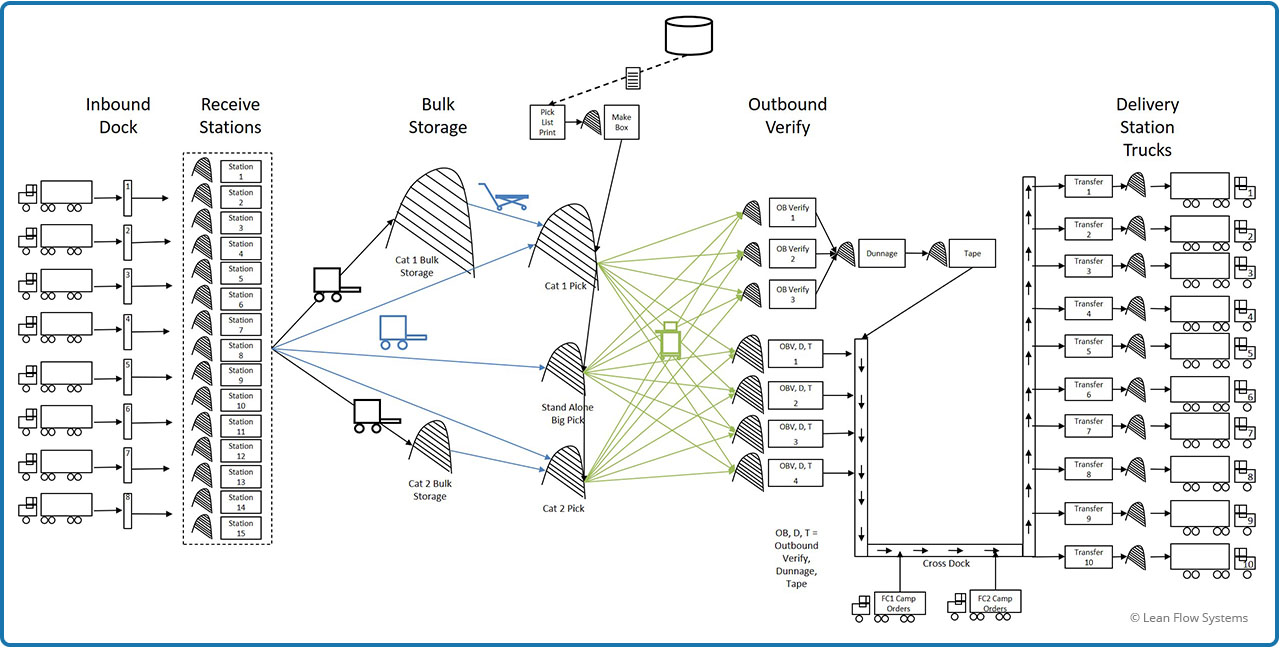
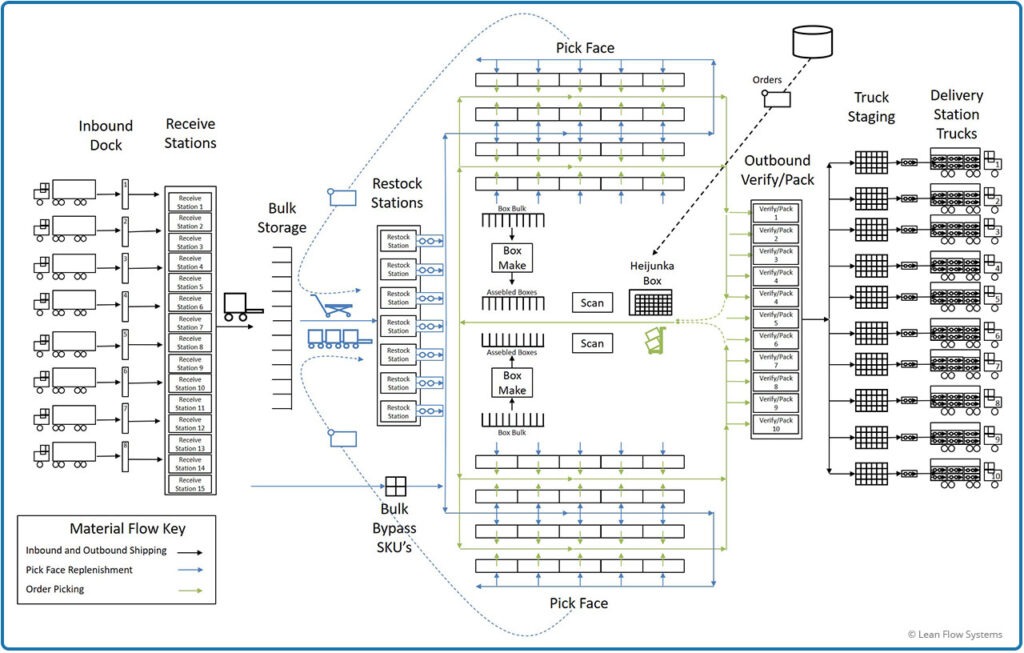
Figure 2, Current State
Figure 3, Target State
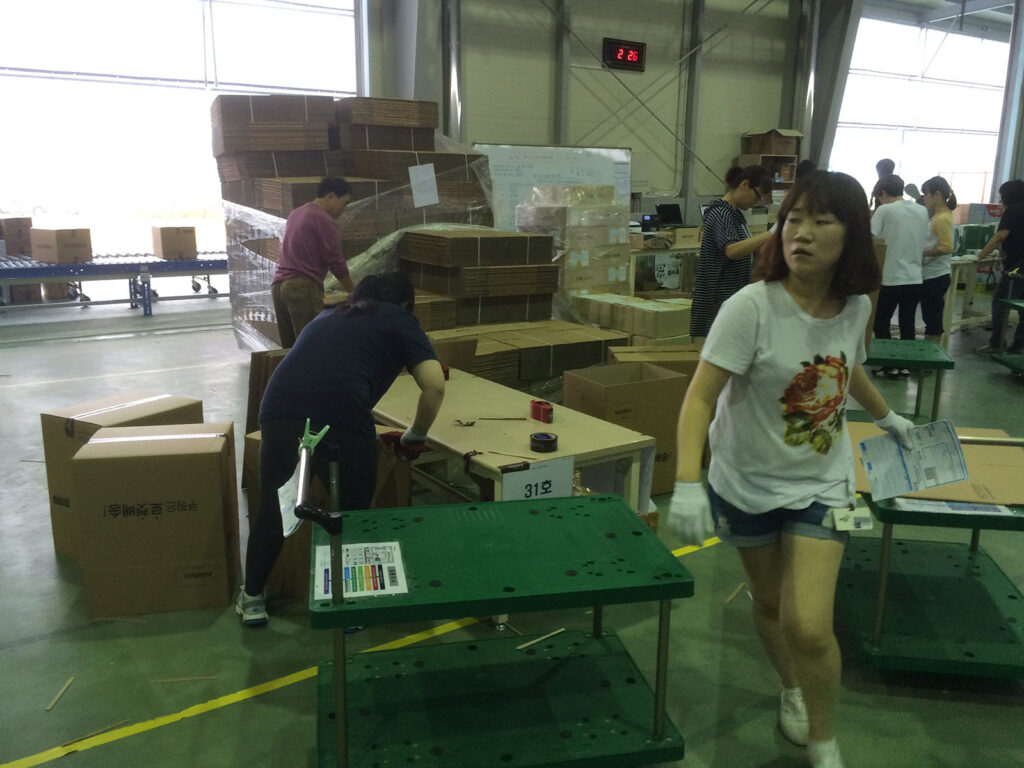
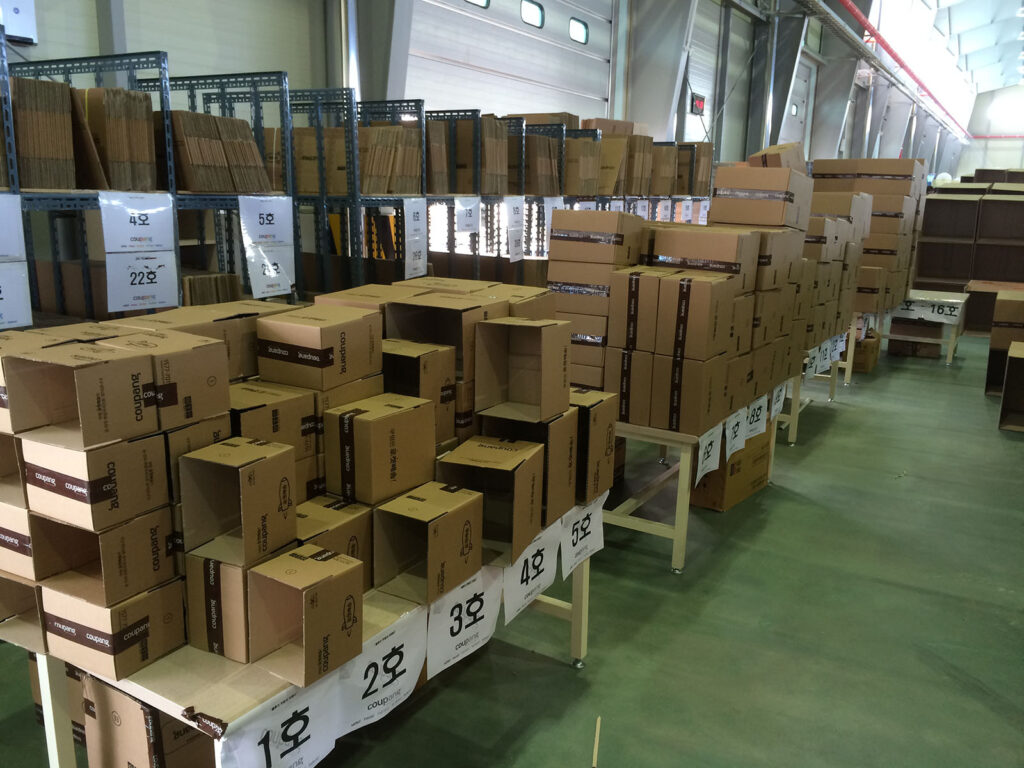
Figure 2 above shows the current state material and information flow. A series of Receive Stations processed products coming from the Inbound Dock. This product was stored in a series of Bulk locations. Fork Trucks routinely delivered products to the Picking Areas. A team of pickers would get their pick tickets, walk to the box area, assemble their boxes and pick parts. These parts were delivered to Outbound Verify Stations to verify the product, add dunnage, tape the box and put the orders on a conveyor to be delivered to the Outbound Dock. Truck Drivers would transfer their orders to the dock floor until they had the majority of their packages, then they would load the packages on their trucks and drive off to their assigned Camp (eg. Depot Station).
There were a number of issues with this process:
Figure 3 shows the Target State design. This design resolved the issues identified in the Current State. Some of the features:
Kaizen Events were organized and run to teach some of these lean tools and test improvement ideas. Following are some before and after photos and videos illustrating the improvements made.

We were asked to do an end-to-end supply chain analysis for Watts Water Technologies, a leading manufacturer of water regulation and control equipment. The company was facing the dual challenge of shortening customer lead times and reducing inventory and transportation costs. They were plagued with frequent regional stock-outs and multiple line item shipments to complete an order. Their transportation costs were high because they often resorted to expensive 2 day UPS shipments across the country due to the stockouts to meet customer lead time expectations.
LFS started the engagement by conducting a Voice of the Customer (VOC) analysis (SEE VOC EXAMPLE for details). The key takeaways from the VOC:
LFS’s deep dive analysis of the Watts supply chain resulted in the following observations:
Customer Lead Time Expectations
Supply Chain
Distribution Centers
LFS’s complete a target conceptual system design and did a deep dive analysis of the West Region DC. The estimated improvements by implementing the target design are summarized below.